
캔들 패턴
7 Key Candlestick Patterns: How to Read Them in Context
A beginner-friendly guide to seven common candlestick patterns, with real-chart examples showing why trend, support, resistance, volume, and confirmation matter.
발행 2026년 8월 19일·조회 7
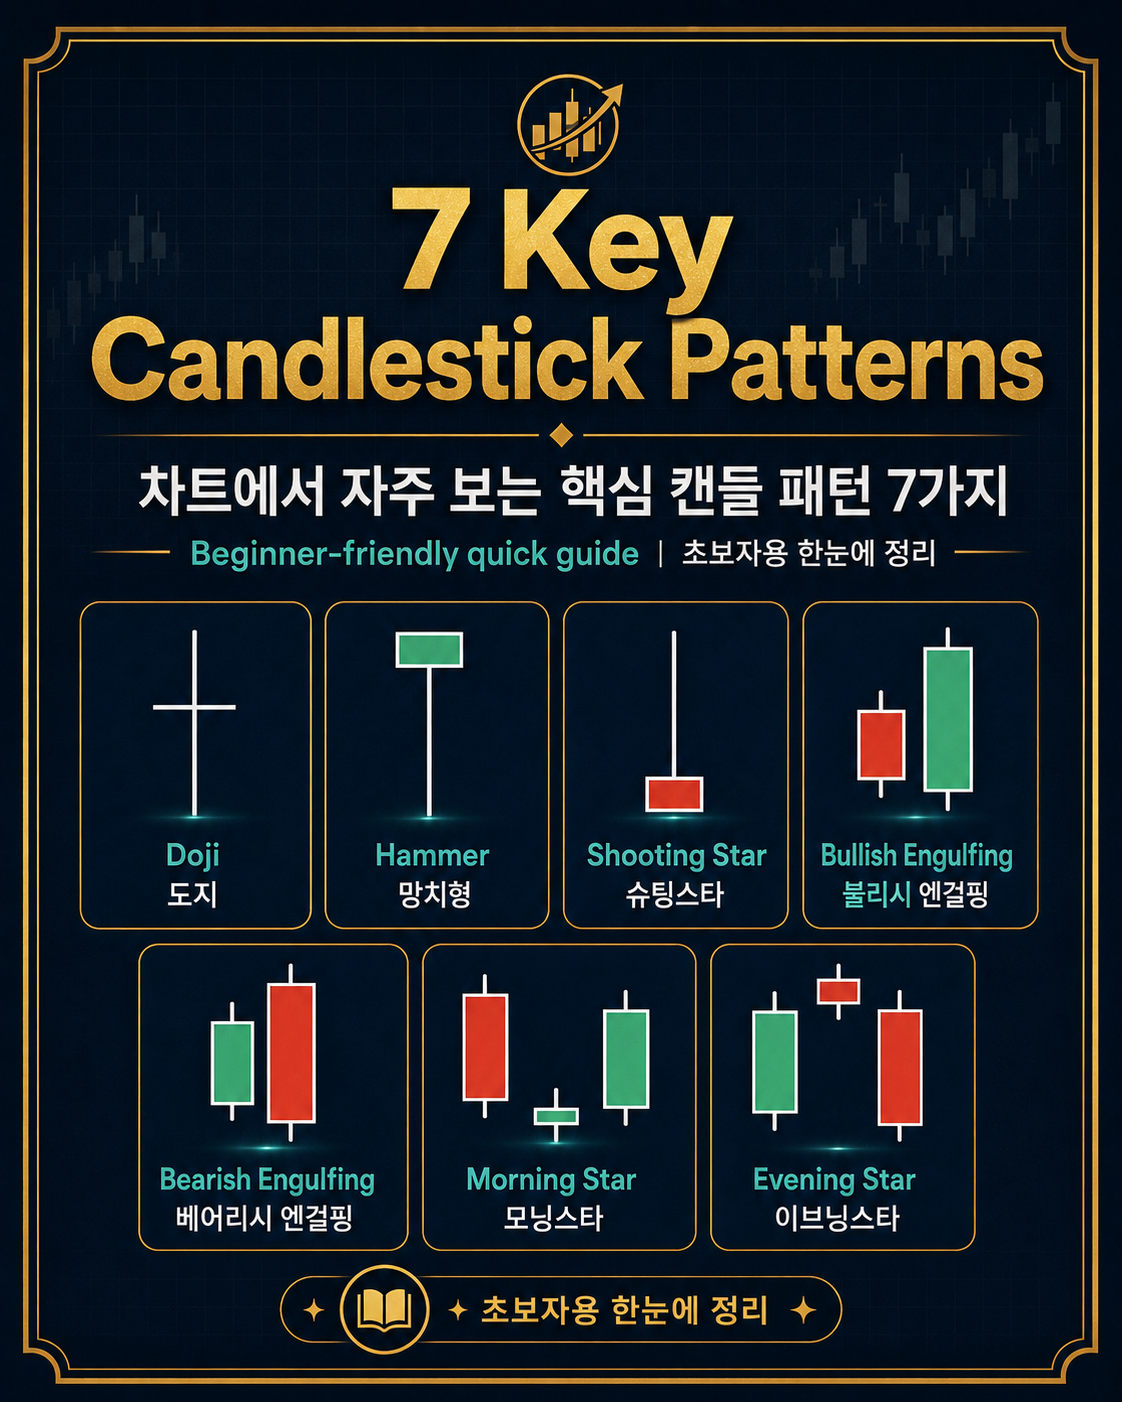
Candlestick charts compress a surprising amount of information into a small space. Each candle shows the open, high, low, and close for a chosen period, while the body and shadows make it easier to see how buyers and sellers behaved during that period.
But a candlestick pattern should not be treated as a prediction by itself.
A candlestick pattern is not a forecast. It is a visual record of how buyers and sellers behaved around a particular price area.
The same candle can mean very different things depending on where it appears. A Hammer near an established support zone after a decline deserves more attention than a Hammer appearing randomly in the middle of a trading range. A Shooting Star near resistance after an extended advance is more meaningful than the same shape without an identifiable prior trend.
That is why candlestick analysis works best when pattern, location, trend, volume, and confirmation are considered together rather than separately. Fidelity also emphasizes the limits of chart patterns and the importance of confirmation rather than assuming that a pattern guarantees the next move.
Before Reading a Candlestick Pattern, Check the Context
Before naming any candle, ask four questions.
What was the prior trend?
Reversal patterns need something to reverse. A bullish reversal setup usually matters more after a decline, while a bearish reversal setup usually matters more after an advance.
Where did the pattern form?
Support and resistance can give the candle context. A rejection candle appearing around a price area that traders are already watching may carry more information than the same formation in the middle of a range. Schwab's technical-analysis education similarly discusses candlestick behavior around support and resistance.
Was there confirmation?
A potential reversal is different from a confirmed reversal. The next candle, a break of a nearby level, or follow-through in price can help determine whether the initial signal actually developed.
What did volume show?
Volume can help show whether participation expanded as buyers or sellers attempted to take control. It should be treated as supporting evidence rather than a guarantee.
With that framework in place, let's look at eight common reversal patterns.
1. Doji at a Swing Low: Potential Bullish Reversal Setup
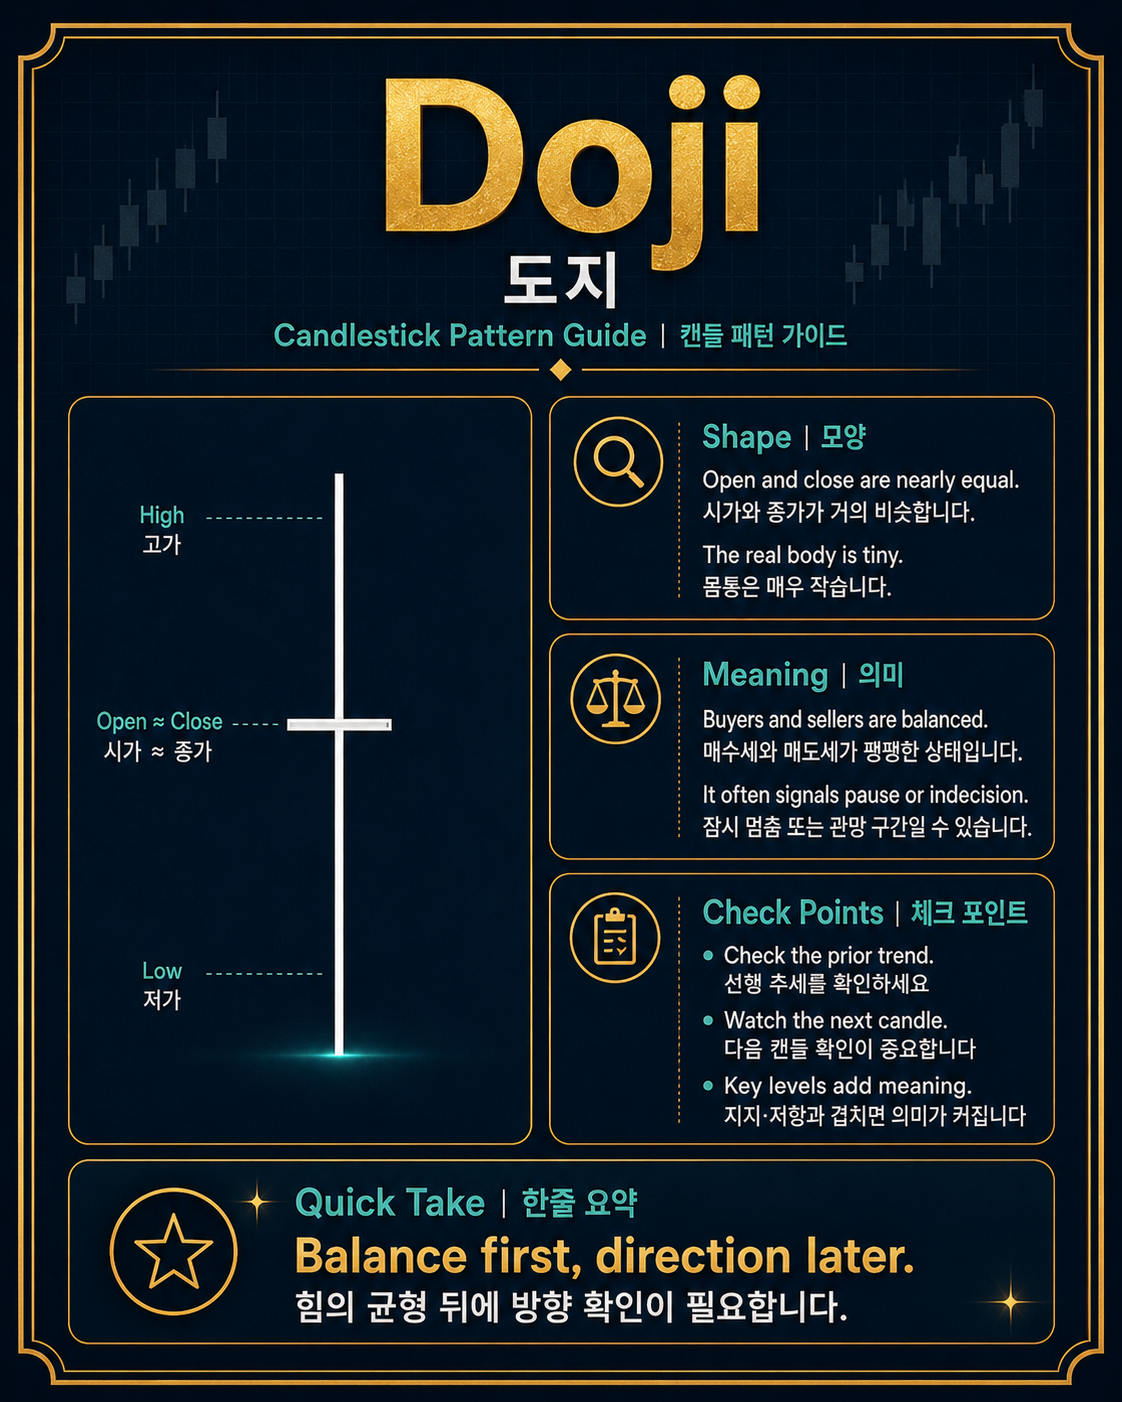
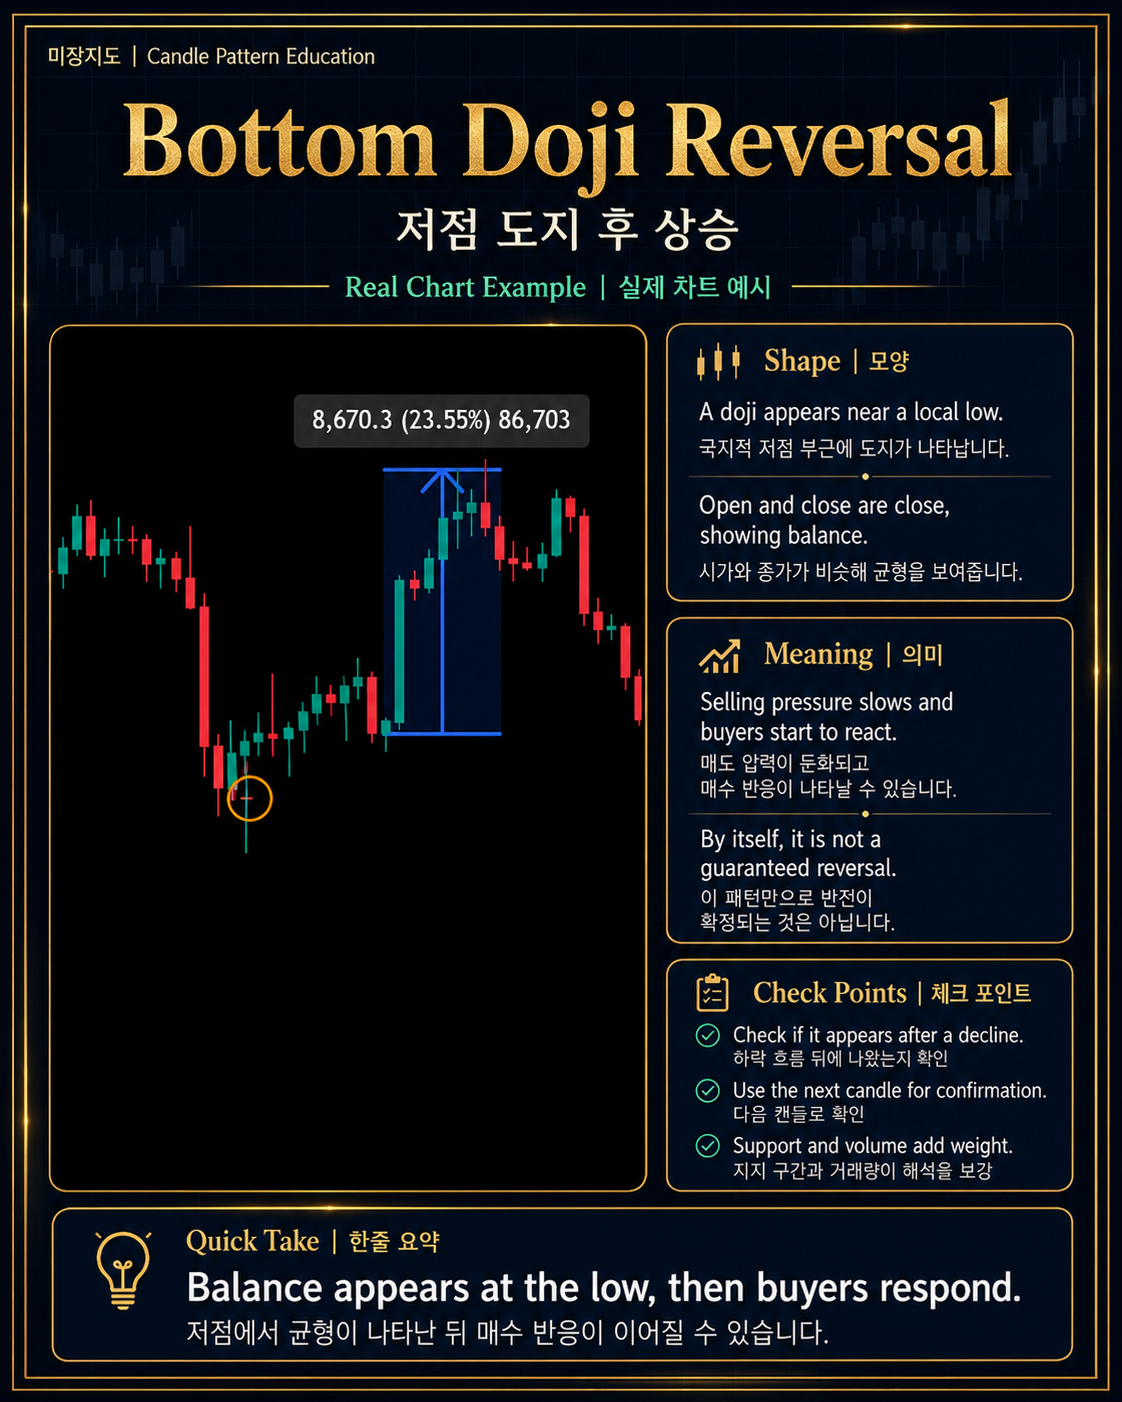
A Doji forms when the opening and closing prices are very close to each other, leaving a very small real body.
The most important point is that a Doji is neutral by itself. It represents indecision rather than an automatic bullish or bearish signal.
After a sustained decline, however, a Doji near a meaningful support area can become more interesting.
Sellers may have controlled the market into the low, but the Doji shows that neither side was able to establish clear control by the close. If buyers then produce a strong follow-through candle, the formation can develop into a potential bullish reversal setup.
What to watch
Look for a prior decline, a meaningful support area, and bullish follow-through after the Doji.
A Doji at support should be treated as:
“Pay attention here.”
Not:
“Price must go higher.”
2. Doji at a Swing High: Potential Bearish Reversal Setup
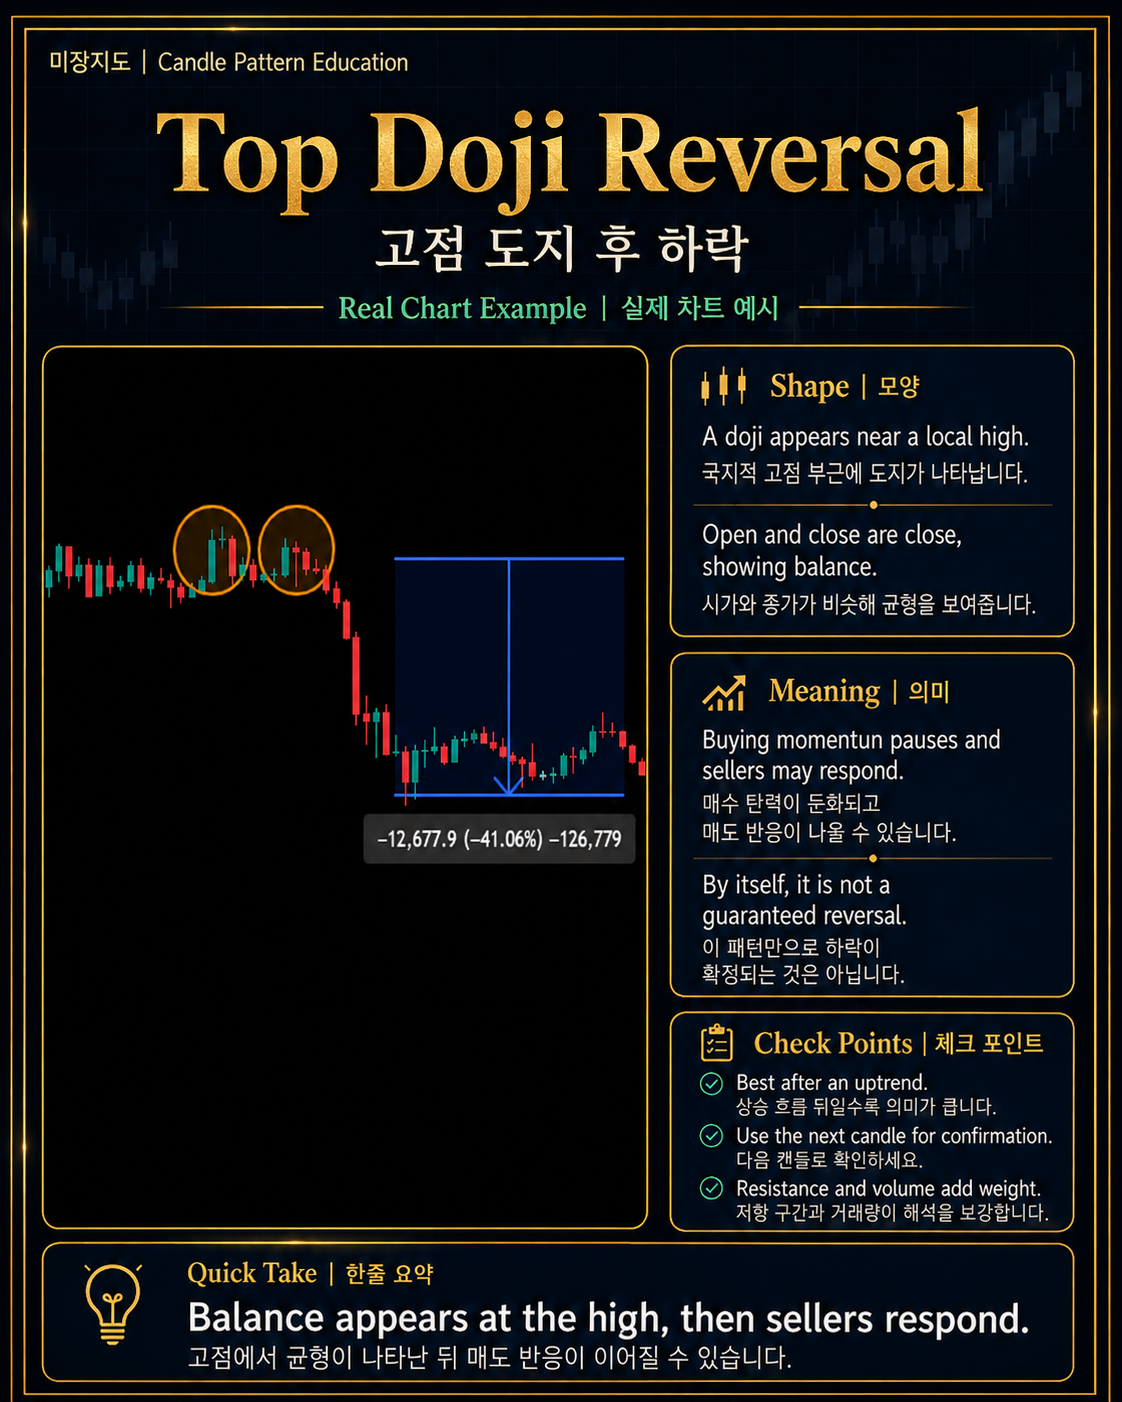
The same Doji takes on a different interpretation when it appears after a strong advance.
At a swing high or near resistance, the market may have reached a point where buyers are no longer able to extend the move with the same strength.
The Doji again represents indecision. The bearish interpretation comes from the location and subsequent price action, not from the Doji alone.
What to watch
Look for an existing uptrend, nearby resistance, failure to continue higher, and bearish confirmation afterward.
Without confirmation, it remains a warning of possible momentum loss rather than proof that a reversal has begun.
3. Bullish Engulfing
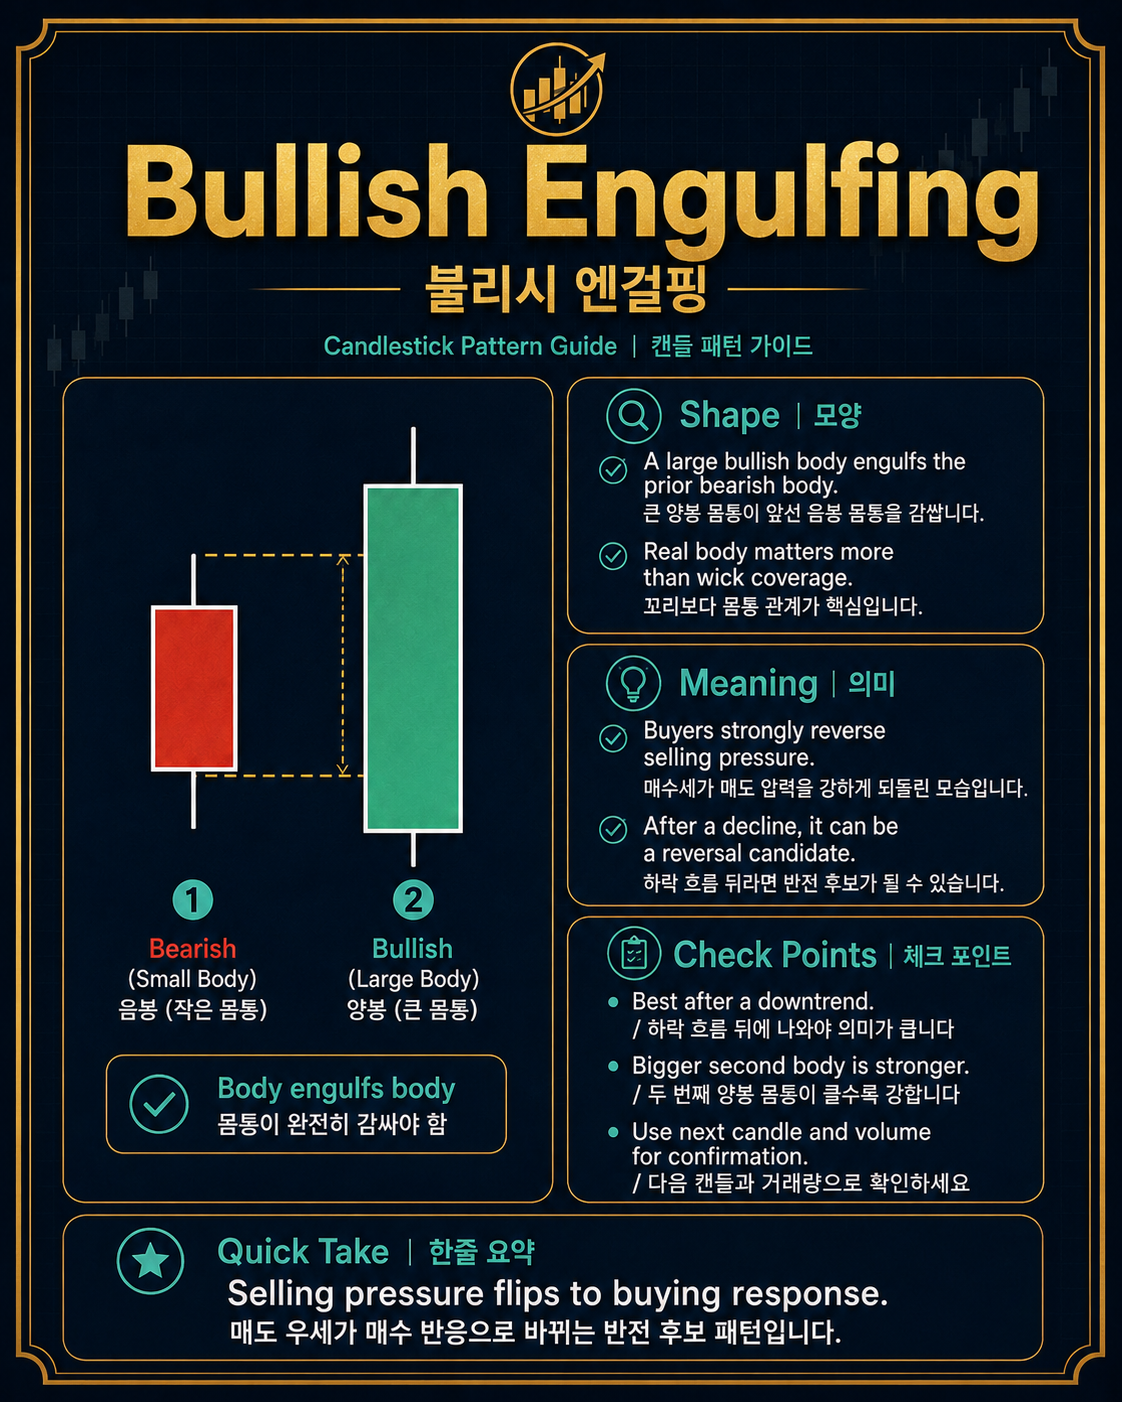
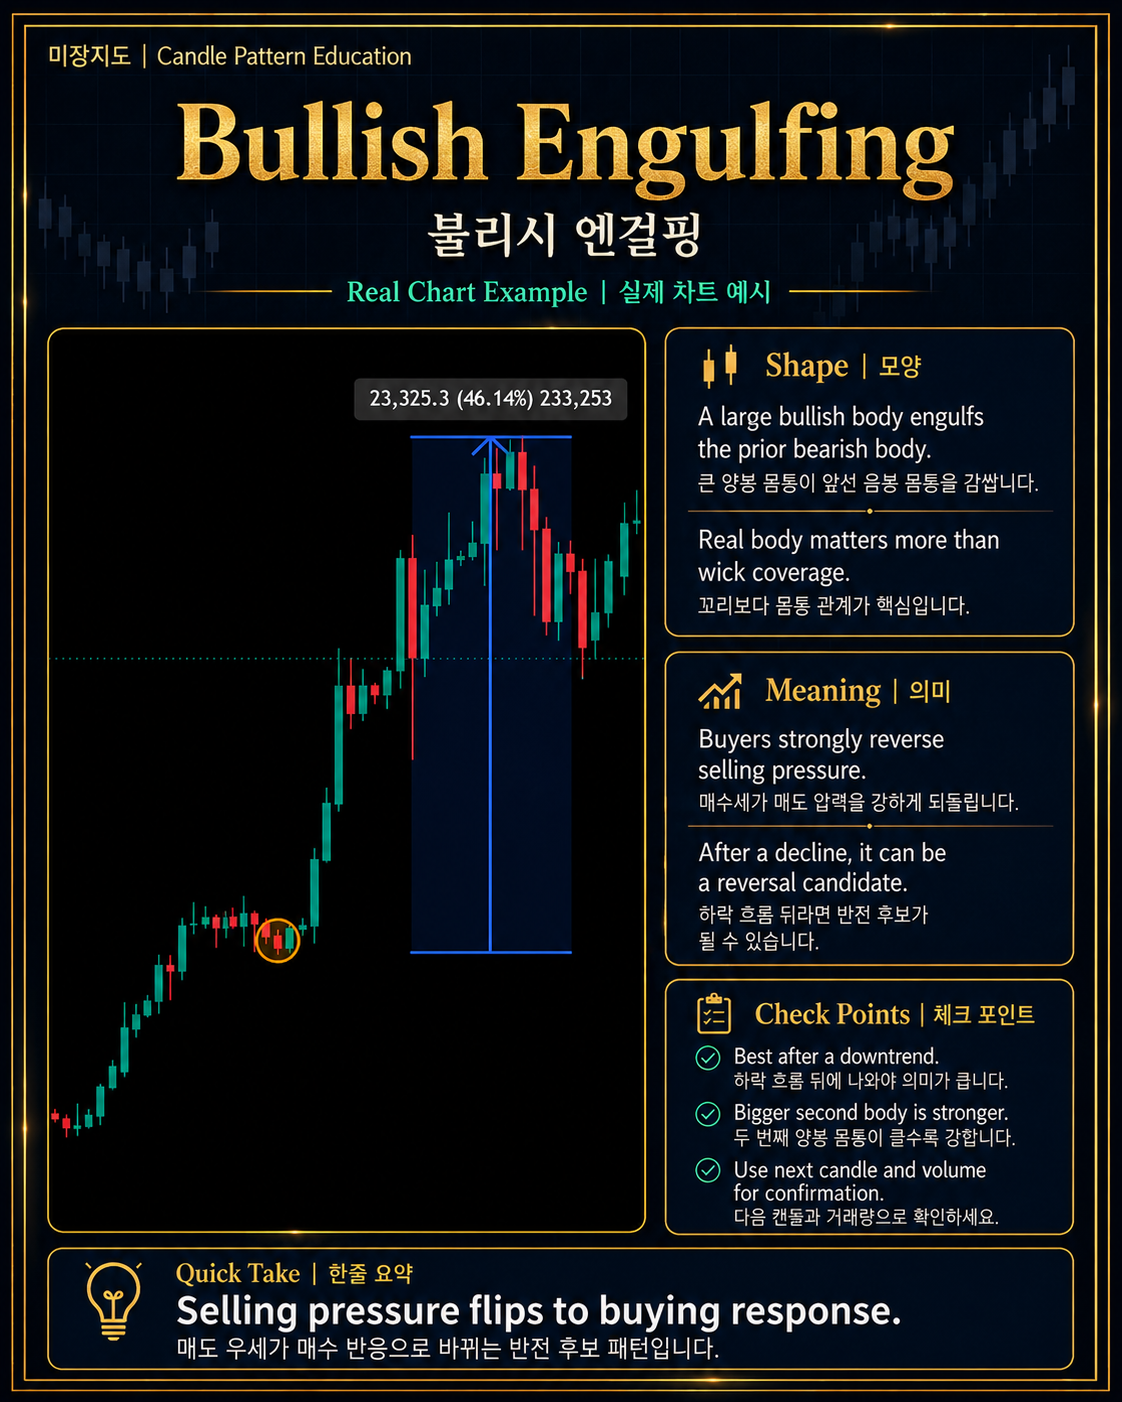
A Bullish Engulfing pattern normally appears after downward price pressure.
It consists of a bearish candle followed by a larger bullish candle whose real body engulfs the real body of the previous candle.
The first candle reflects selling pressure. The second shows a sharp change in control as buyers overcome the previous session's body.
This shift becomes more meaningful when it occurs after a decline and around a support area.
What to watch
Check the prior downtrend first.
Then ask:
Did the pattern form near support?
Was the second candle decisively stronger?
Did volume expand?
Did price continue higher afterward?
An engulfing pattern appearing at a random location is less informative than one that forms where buyers already have a reason to respond.
4. Bearish Engulfing
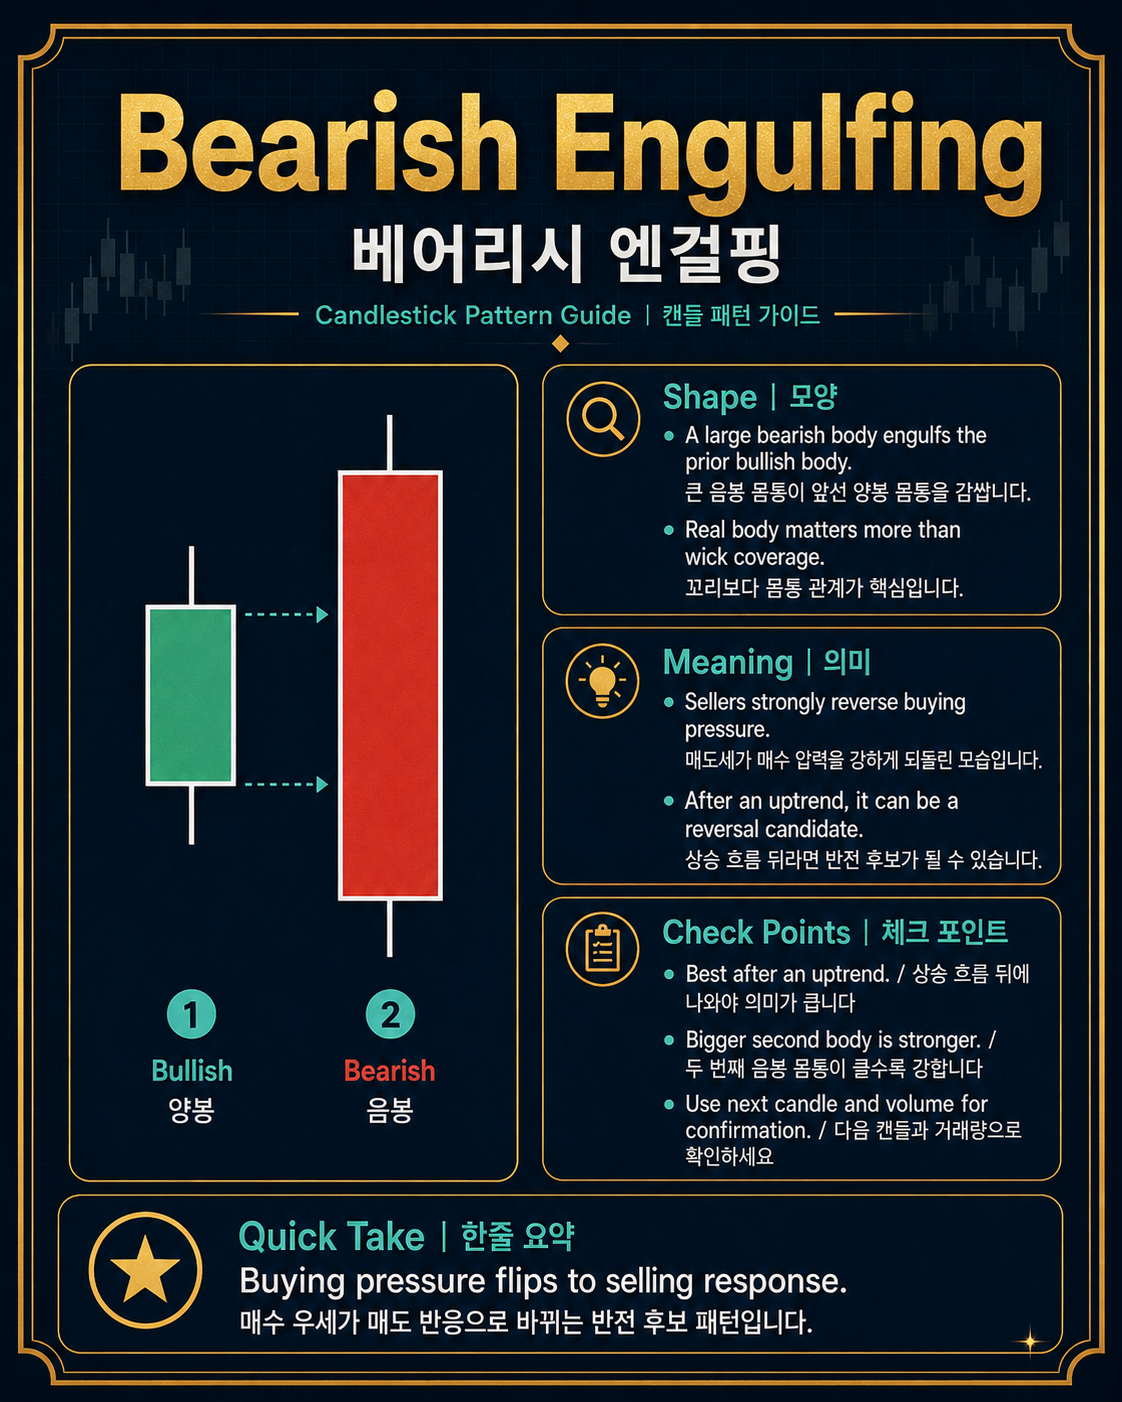
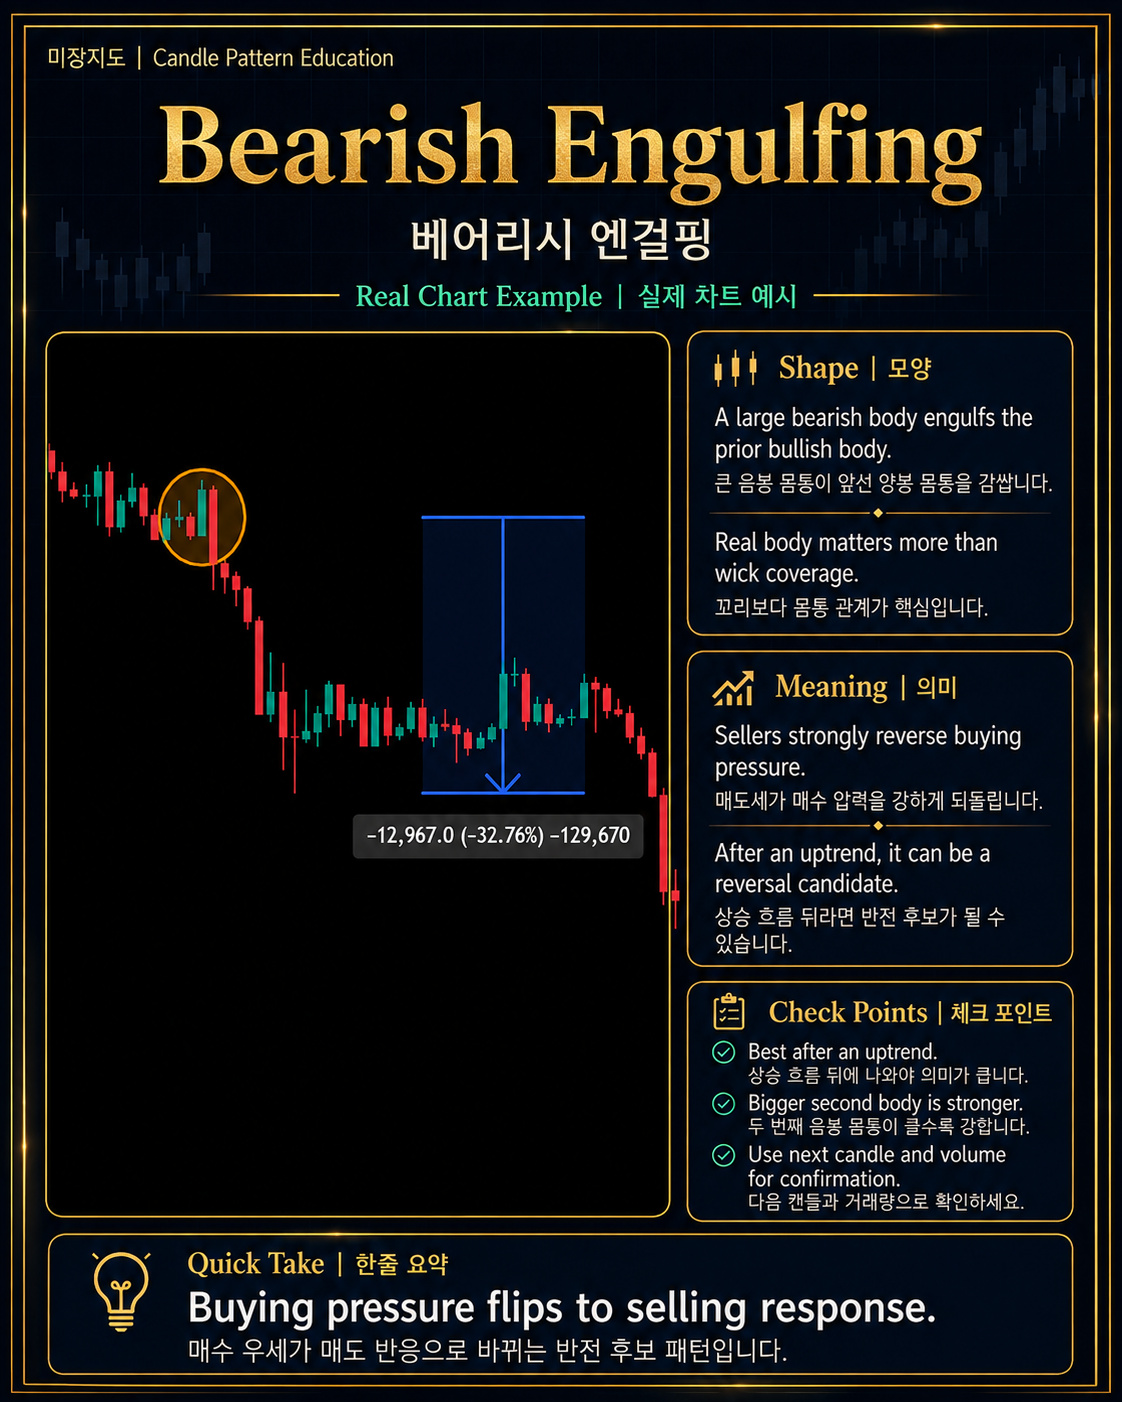
A Bearish Engulfing pattern is the opposite setup.
A bullish candle is followed by a larger bearish candle whose real body engulfs the previous bullish body.
Buyers initially had control, but the second candle shows sellers overwhelming that buying pressure.
The setup becomes more relevant after an established advance, especially near a resistance area.
What to watch
Start with the prior uptrend.
Then look for resistance, stronger selling participation, and bearish follow-through.
A Bearish Engulfing candle is evidence that the balance between buyers and sellers may be shifting. It is not, by itself, proof that a larger downtrend will follow.
5. Hammer
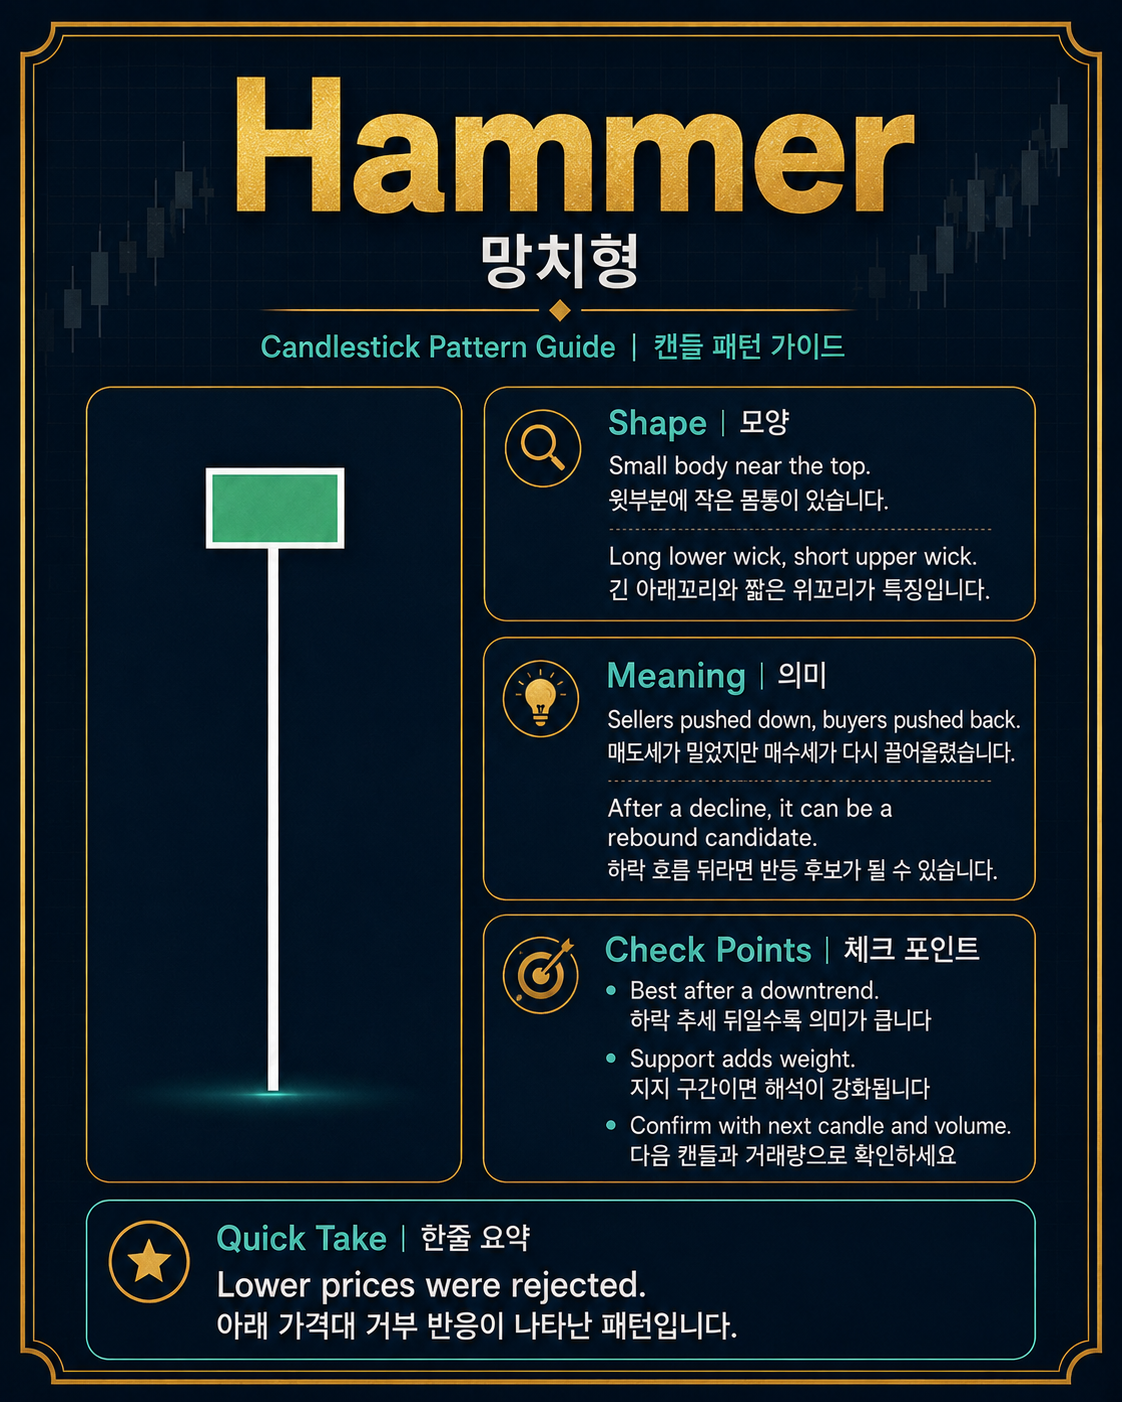
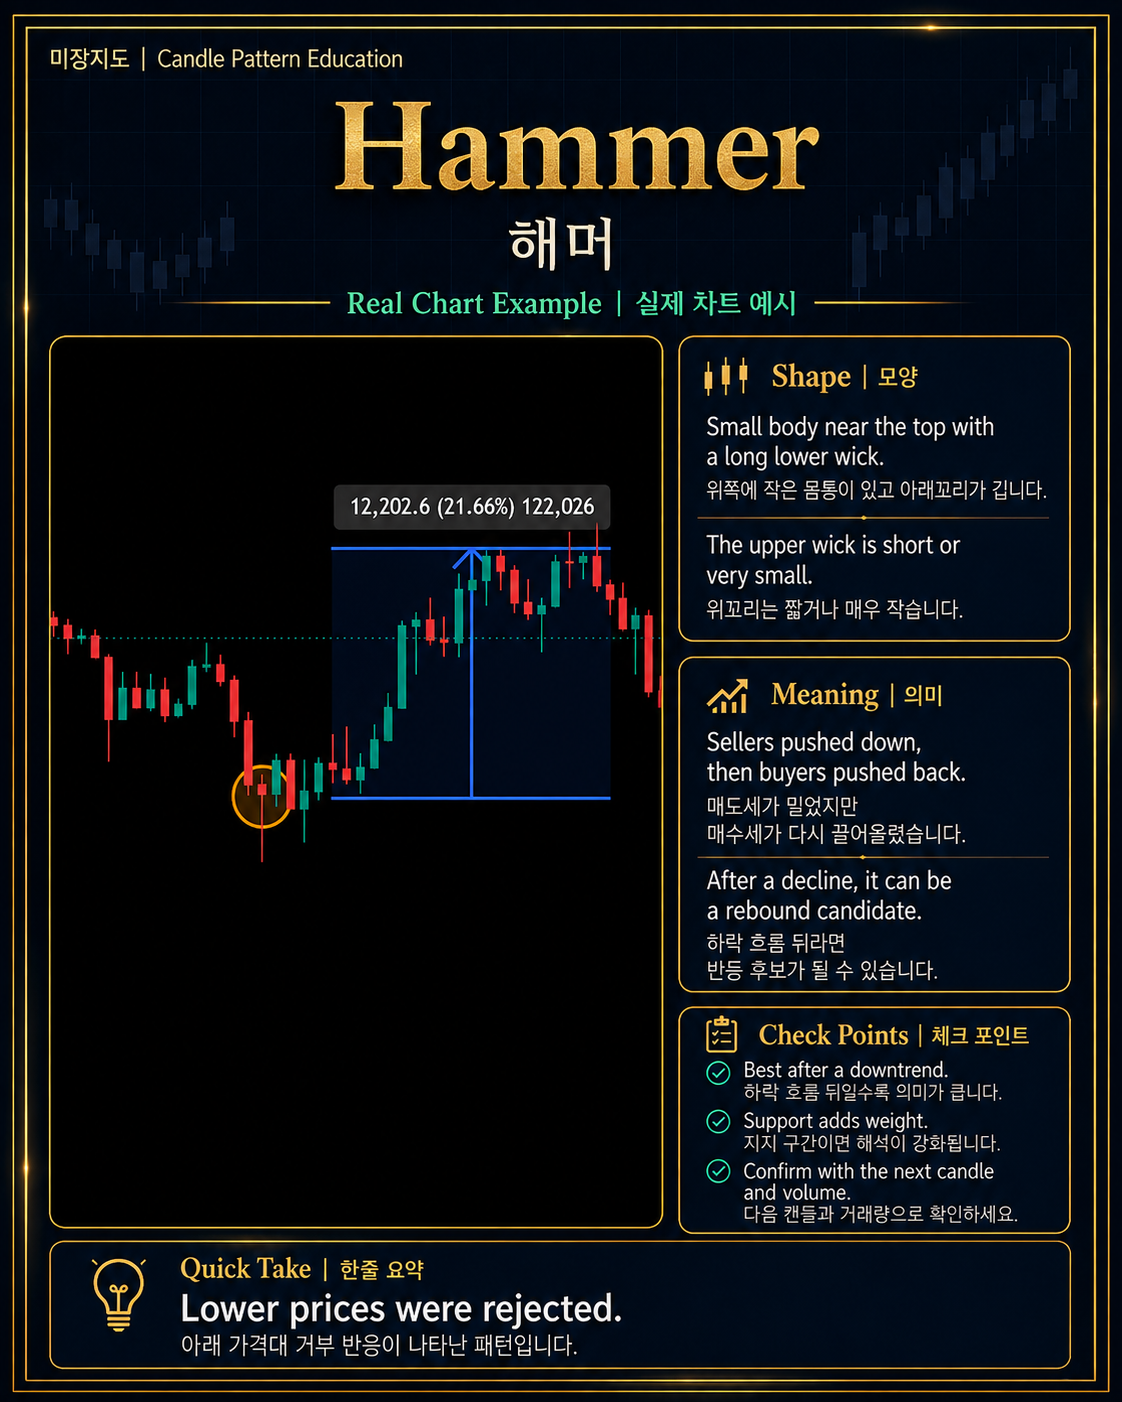
The Hammer is a single-candle reversal pattern that typically appears after a decline.
It usually has a relatively small real body near the upper part of the candle's range and a long lower shadow.
That long lower shadow tells the story.
Sellers pushed price substantially lower during the period, but buyers responded strongly enough to drive price back toward the upper portion of the range before the candle closed.
The color of the body is less important than the shape, location, and subsequent confirmation.
What to watch
A Hammer is more relevant when it forms after a decline and around a support zone.
The lower shadow shows rejection of lower prices, but buyers still need to prove that they can sustain control.
A stronger next candle can provide that additional evidence.
6. Shooting Star
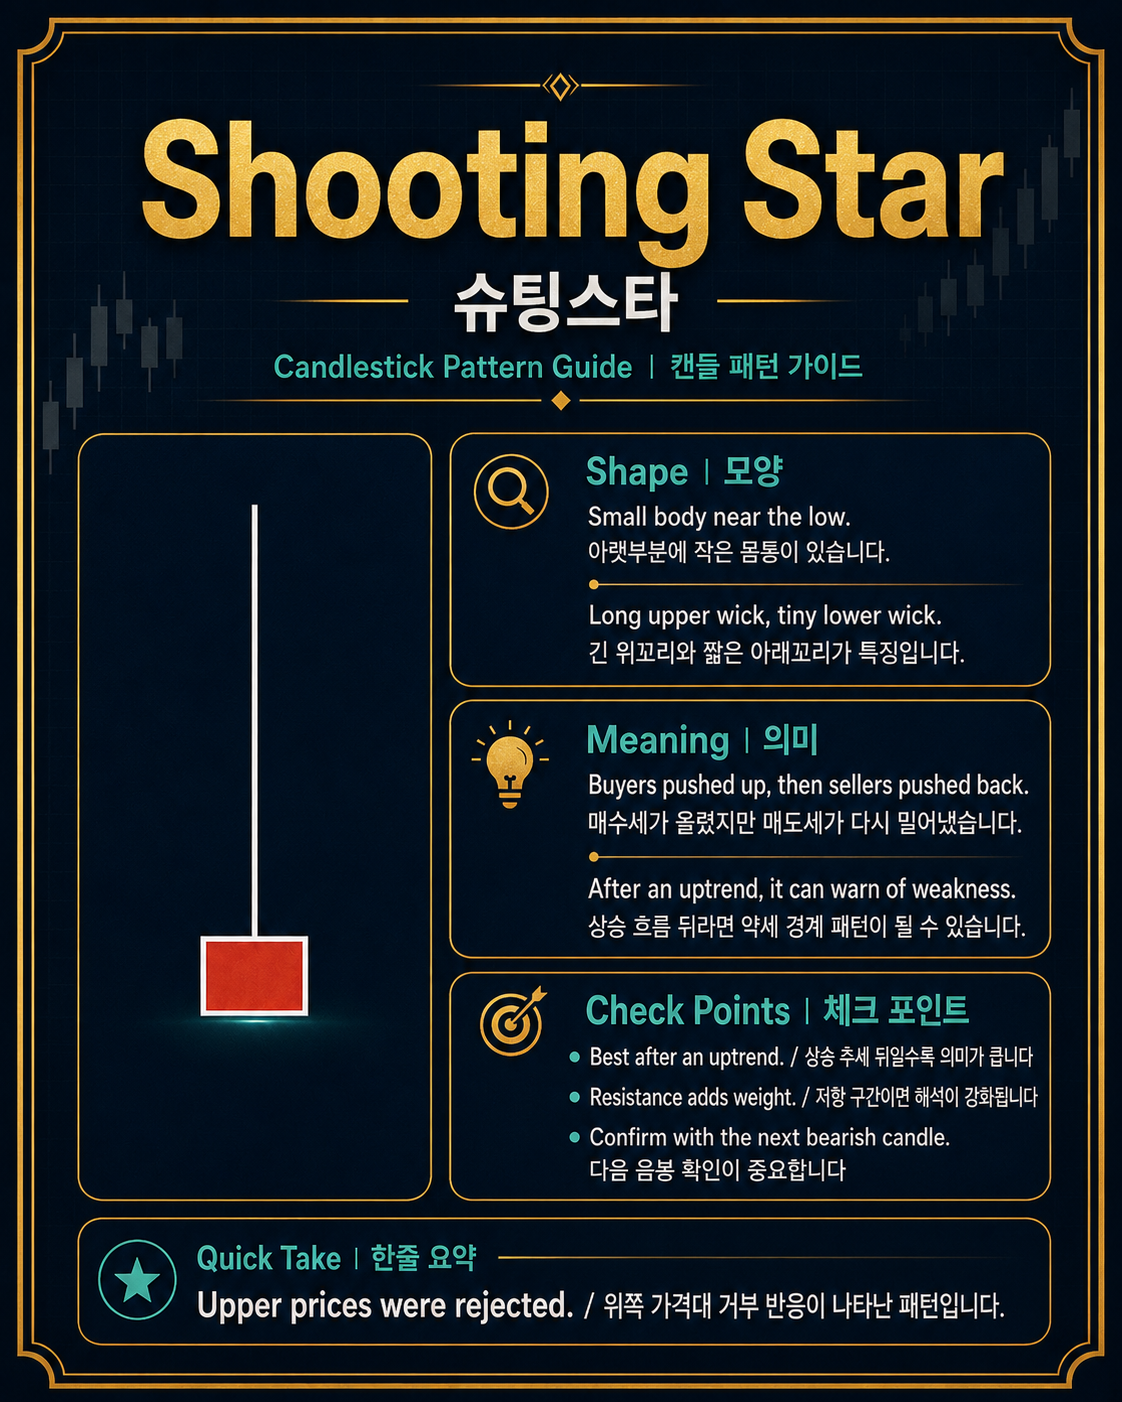
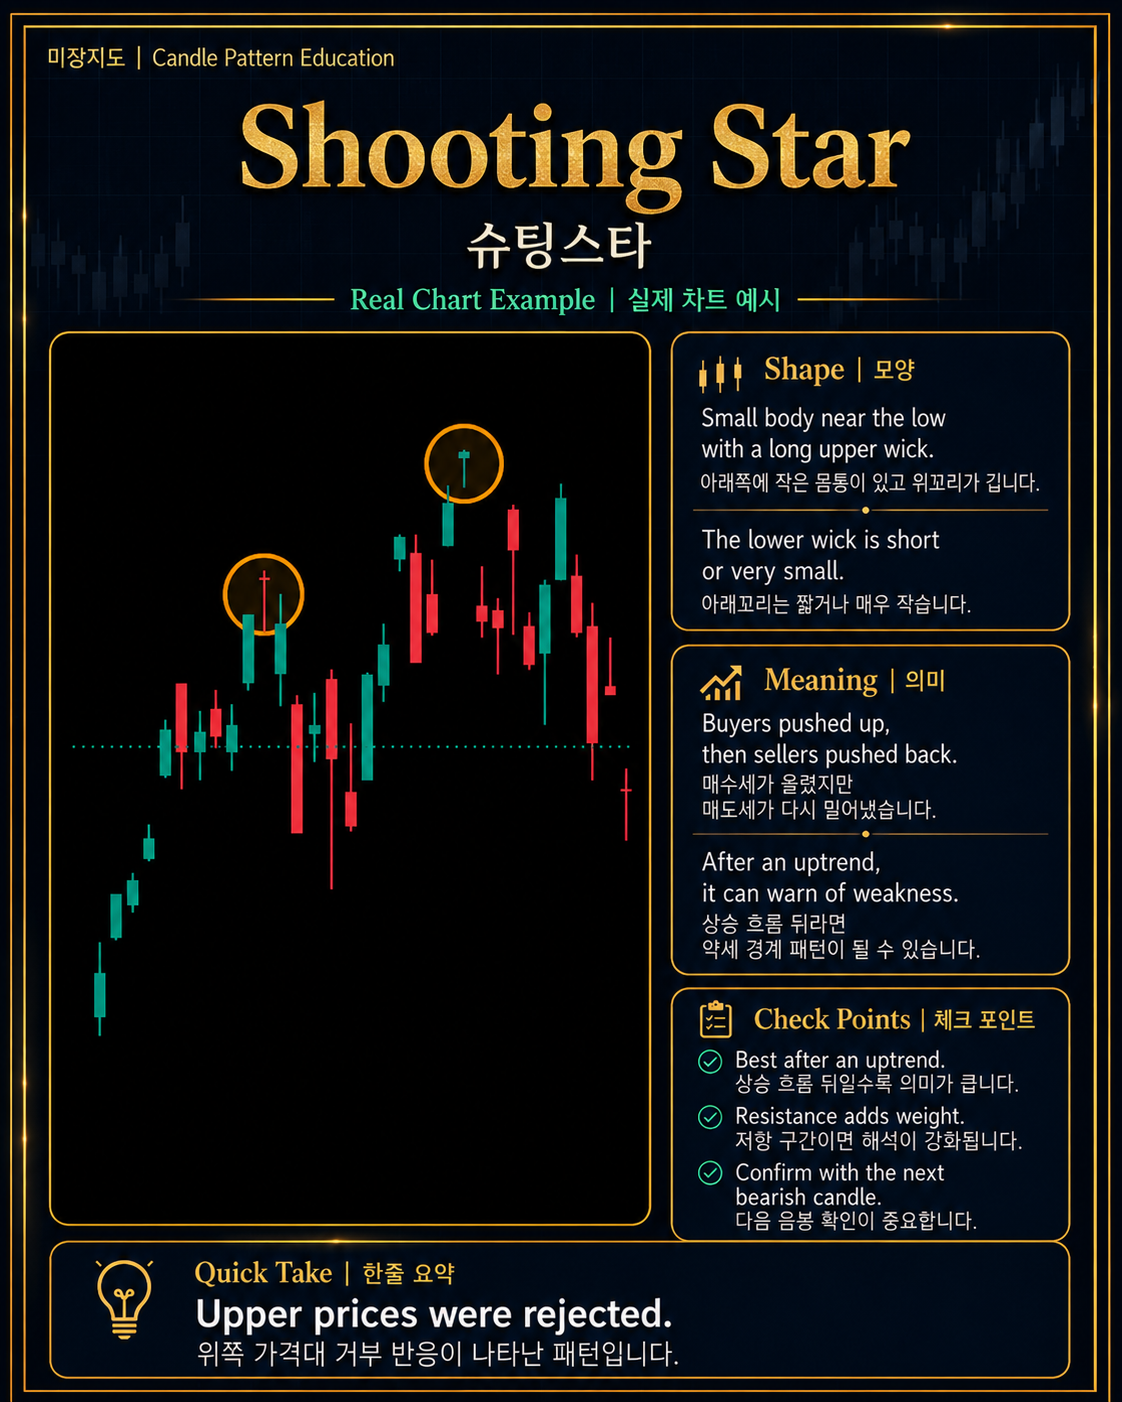
The Shooting Star is essentially the bearish counterpart to the Hammer in terms of market context.
It normally appears after an advance and has a small real body near the lower portion of the range with a long upper shadow.
During the period, buyers pushed price higher. That move failed to hold, and sellers forced price back toward the lower portion of the candle.
The long upper shadow therefore represents rejection of higher prices.
What to watch
Look for a Shooting Star after an established advance, particularly near resistance.
Then wait to see whether sellers can follow through.
Without bearish confirmation, the candle tells you that higher prices were rejected—it does not guarantee that a downtrend will begin.
7. Morning Star
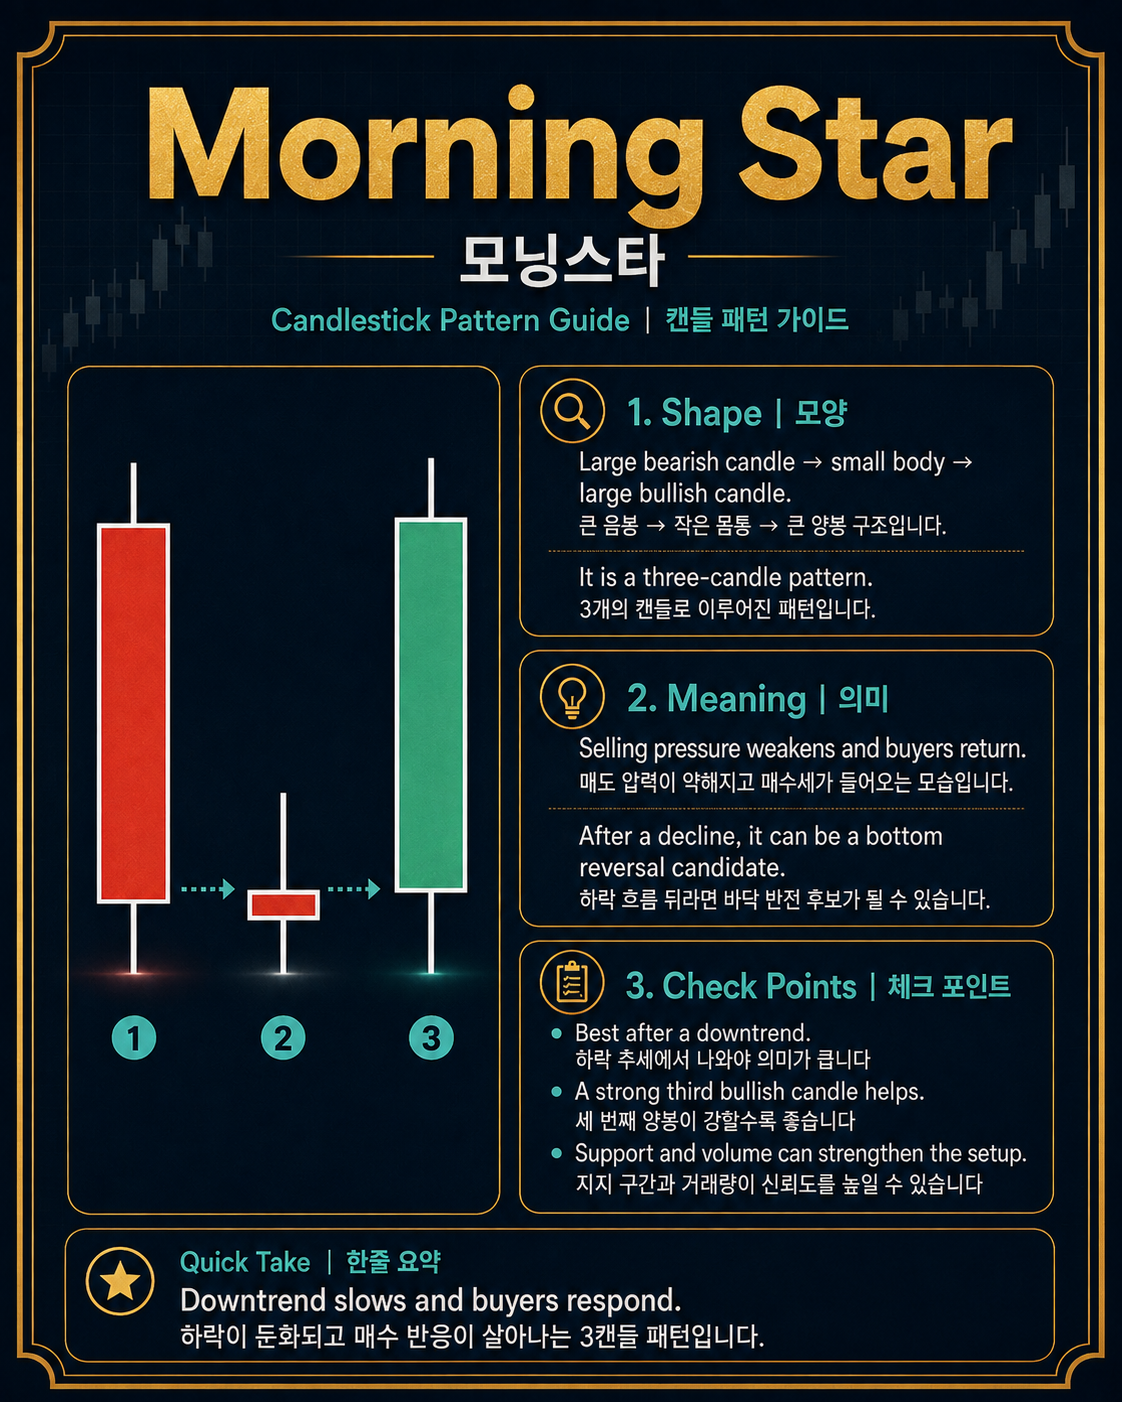
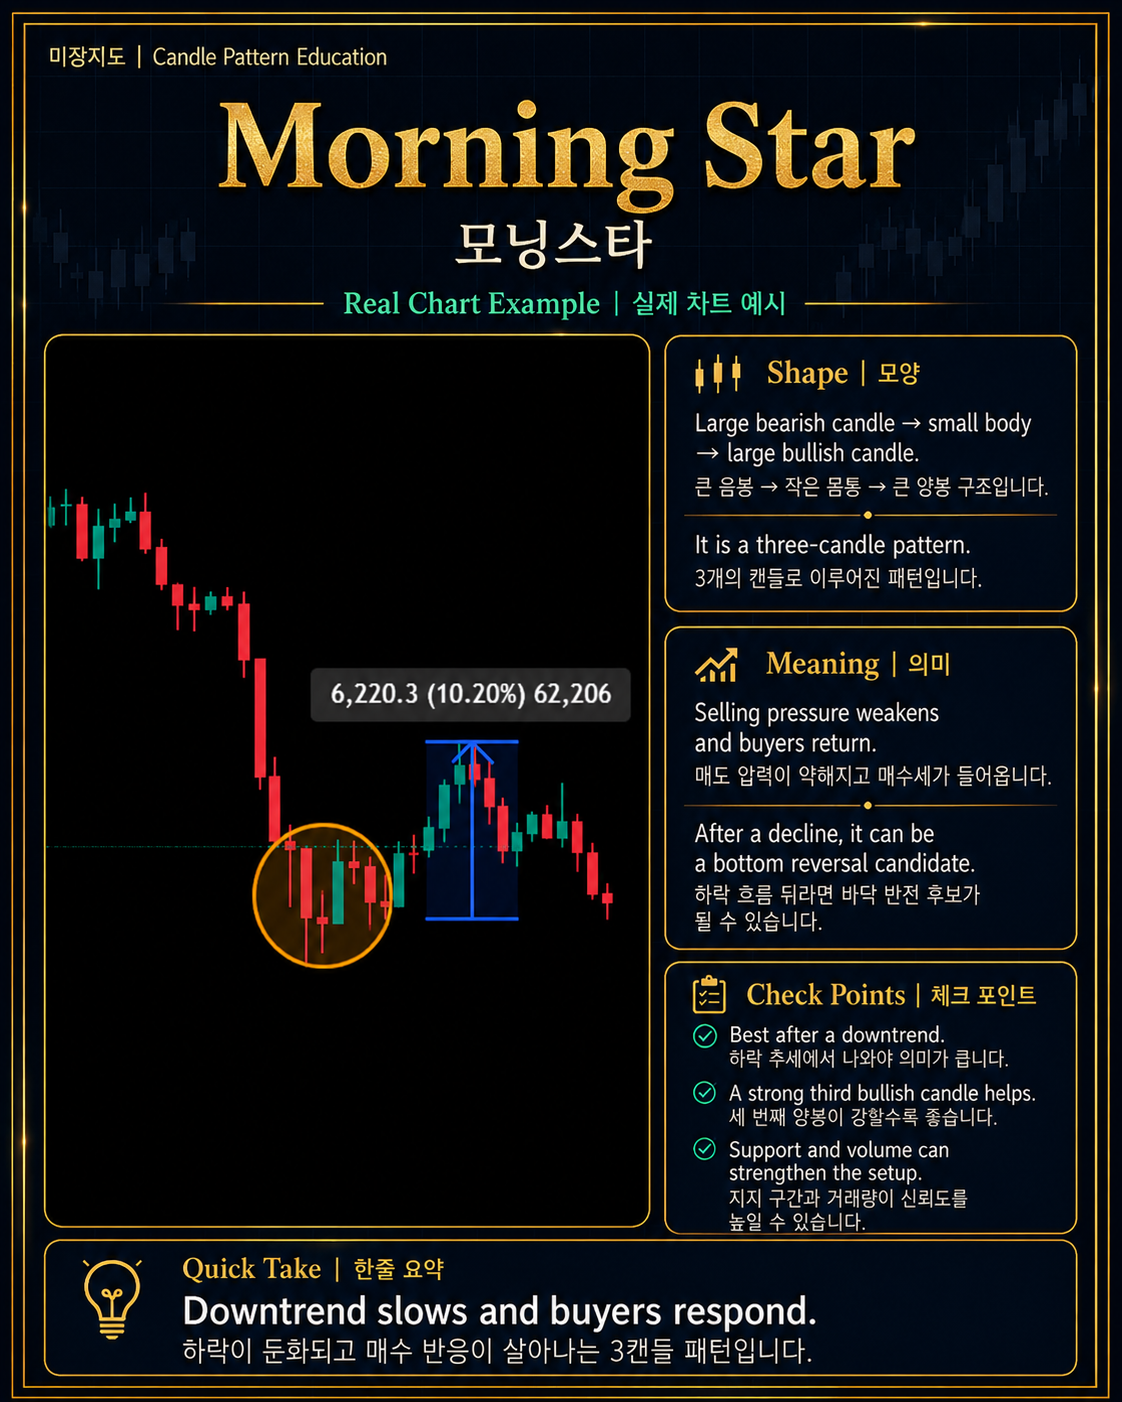
The Morning Star is a three-candle bullish reversal formation.
Its classic structure begins with a strong bearish candle during a decline.
The second candle has a relatively small body, showing that the previous selling momentum is beginning to stall.
The third candle is a strong bullish candle that moves back into the body of the first candle.
Together, the sequence shows a transition:
Selling pressure → indecision → stronger buying pressure.
Traditional descriptions of the pattern give greater weight to a strong third candle that closes well into the first candle's real body.
What to watch
Check for a clear prior decline.
Then evaluate whether the middle candle actually represents a loss of downside momentum and whether the third candle demonstrates meaningful buying strength.
Support and increasing participation can add useful context.
8. Evening Star
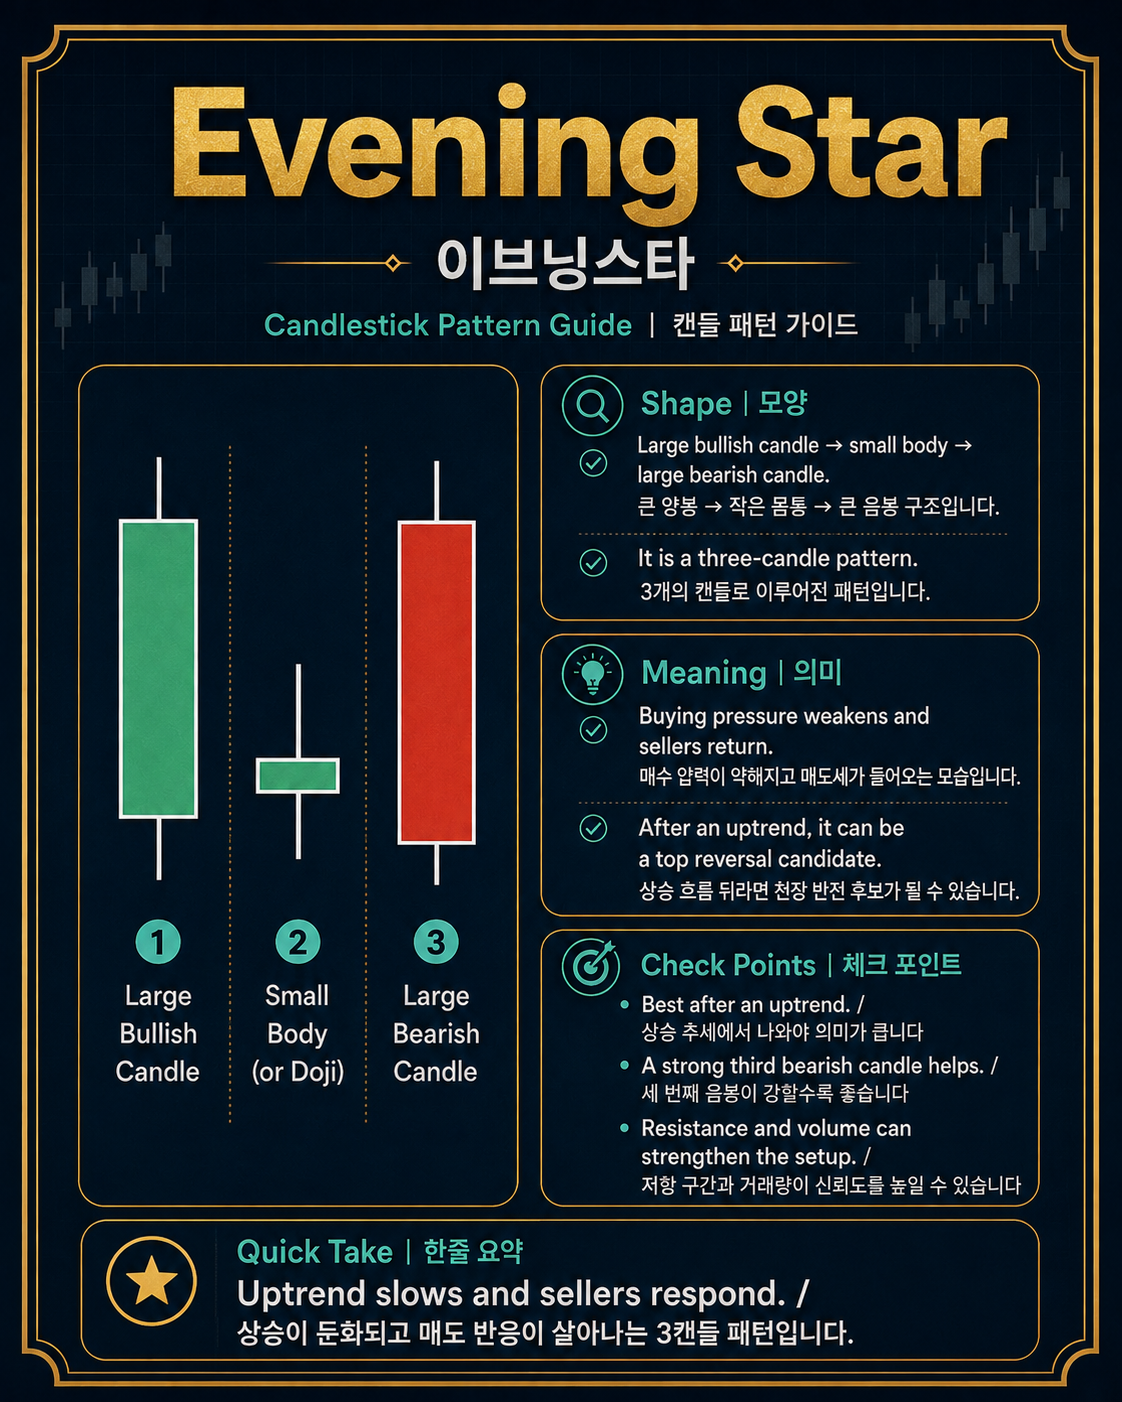
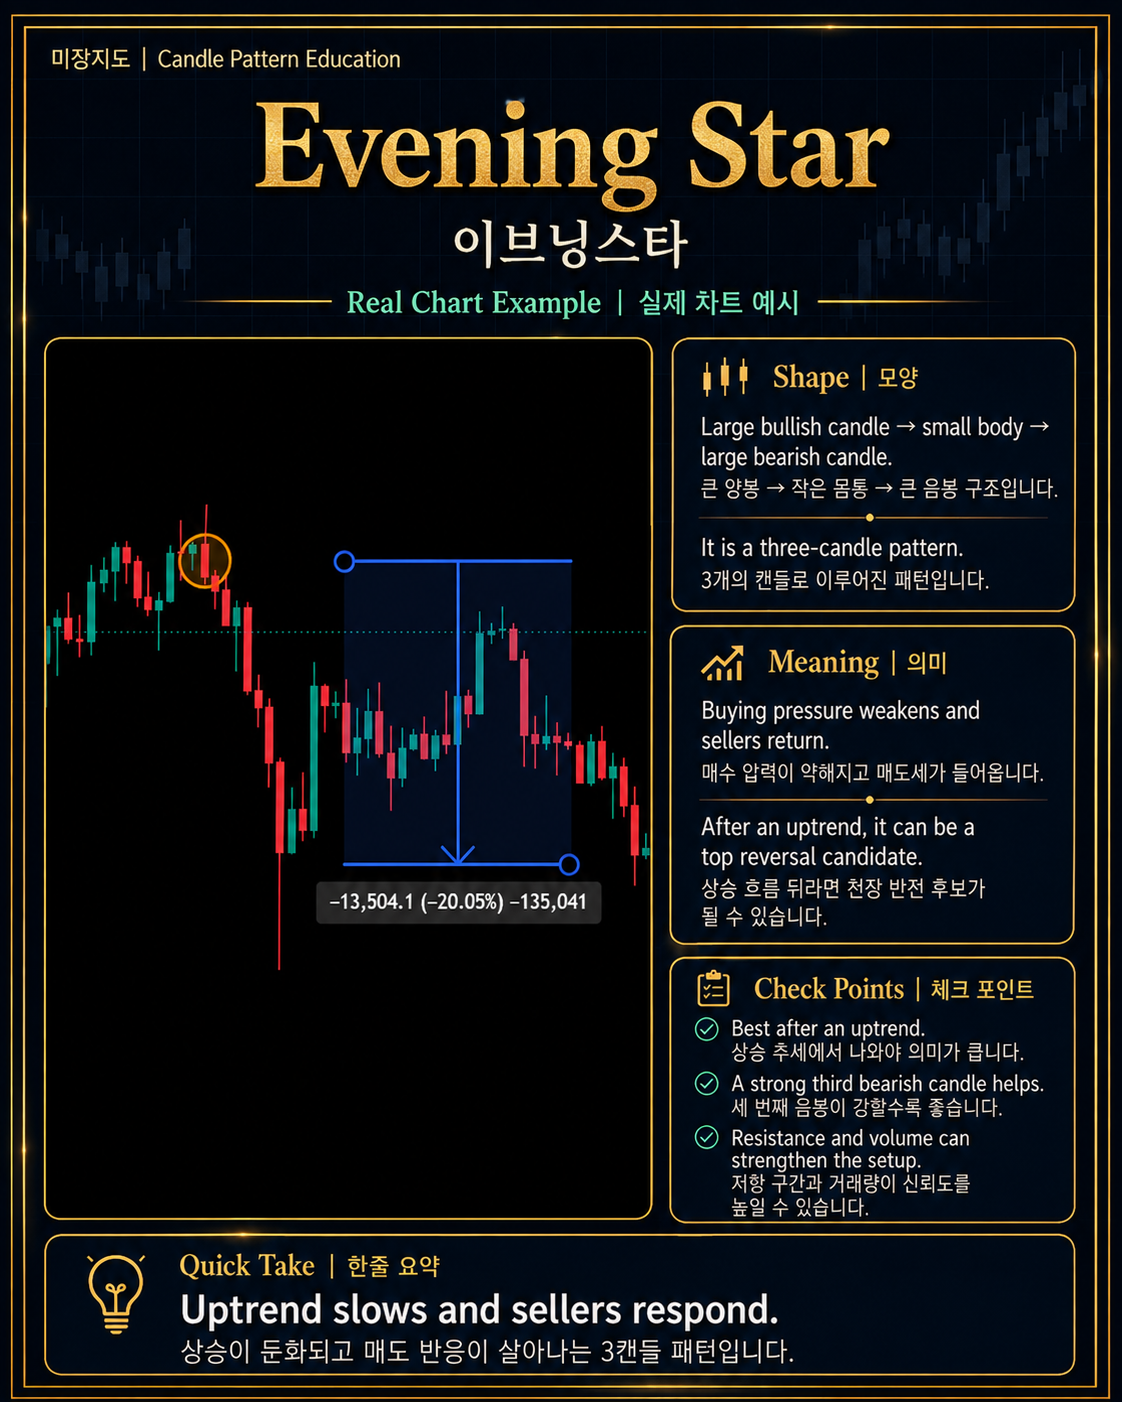
The Evening Star is the bearish counterpart to the Morning Star.
It typically forms after an advance.
The first candle is strongly bullish.
The second candle has a smaller body, signaling hesitation or weakening momentum.
The third candle is strongly bearish and moves back into the body of the first candle.
The sequence represents:
Buying pressure → indecision → stronger selling pressure.
A deeper bearish third candle generally provides more convincing evidence that control has shifted toward sellers.
What to watch
Look for a prior uptrend, a loss of momentum around the middle candle, and decisive bearish follow-through.
Resistance near the pattern can make the setup more relevant.
Again, the pattern identifies a possible change in behavior—not a guaranteed future price path.
Quick Reference: The 8 Patterns
| Pattern | Typical Context | What It Suggests | What to Confirm |
|---|---|---|---|
| Doji at Swing Low | After a decline | Indecision near a possible low | Bullish follow-through |
| Doji at Swing High | After an advance | Indecision near a possible high | Bearish follow-through |
| Bullish Engulfing | Downtrend / support | Buyers overwhelm prior selling | Continued buying |
| Bearish Engulfing | Uptrend / resistance | Sellers overwhelm prior buying | Continued selling |
| Hammer | Downtrend / support | Rejection of lower prices | Stronger next candle |
| Shooting Star | Uptrend / resistance | Rejection of higher prices | Bearish next candle |
| Morning Star | After a decline | Selling fades and buyers take control | Strong third candle |
| Evening Star | After an advance | Buying fades and sellers take control | Strong third candle |
Why Support and Resistance Matter
Candlestick patterns become easier to interpret when they are connected to price location.
Imagine two identical Hammers.
The first forms in the middle of a wide trading range with no obvious nearby level.
The second forms after a decline directly around an established support zone.
The candles may look identical, but the second has more context.
The support zone tells you where market participants may respond.
The Hammer tells you how price behaved when that area was tested.
The next candle tells you whether buyers were able to follow through.
This is why Mijang Map treats candlestick patterns as one layer of evidence rather than a stand-alone prediction.
A Simple Confirmation Framework
A practical way to read reversal patterns is:
Level first → Pattern second → Confirmation third.
First, identify whether price is approaching a meaningful support or resistance area.
Second, watch how the candle behaves at that area.
Third, wait for the market to show whether the attempted reversal actually receives follow-through.
Volume and broader market conditions can then provide additional context.
This approach shifts the question from:
“Which pattern predicts the next move?”
to:
“What evidence would confirm that buyers or sellers are actually taking control?”
That distinction matters.
Common Mistakes When Reading Candlestick Patterns
Treating every pattern as a trade signal
Recognizing a Hammer does not automatically mean “buy,” and recognizing a Shooting Star does not automatically mean “sell.”
Pattern recognition and trade confirmation are two different steps.
Ignoring the prior trend
A reversal pattern needs a trend or directional move to reverse.
Without context, the same candle shape may have very little meaning.
Ignoring price location
Support and resistance can provide the location that makes a pattern relevant.
Entering before confirmation
One candle can show rejection or indecision without producing a sustained reversal.
Waiting for additional price evidence can help distinguish a setup from an actual change in direction.
Assuming the candle's color is everything
Shape, wick structure, prior trend, location, and follow-through can matter more than whether a single candle is red or green.
Believing historical patterns guarantee future results
Technical patterns are based on historical price behavior. They can help organize observations and define conditions to watch, but they cannot reliably guarantee future price movements. Fidelity specifically cautions against treating patterns or market lore as certainty without evidence.
Frequently Asked Questions
Is a Doji bullish or bearish?
Neither by itself.
A Doji primarily represents indecision because the open and close are very close. Its interpretation depends on the prior trend, its location, and what price does afterward.
Is a Hammer always bullish?
A Hammer is generally interpreted as a potential bullish reversal pattern when it forms after a decline.
Its shape alone is not enough. Location and confirmation matter.
What is the difference between a Hammer and a Shooting Star?
Both feature a small body and a long shadow, but their context and shadow direction differ.
A Hammer typically forms after a decline and has a long lower shadow.
A Shooting Star typically forms after an advance and has a long upper shadow.
Does an Engulfing candle have to engulf the entire previous candle, including the wicks?
In the traditional Bullish and Bearish Engulfing pattern, the key comparison is generally the real bodies of the two candles rather than requiring the entire high-to-low range to be engulfed.
Which candlestick reversal pattern is the strongest?
There is no single pattern that is always strongest.
A pattern with strong contextual confirmation—such as an established trend, a meaningful support or resistance zone, convincing follow-through, and supporting volume—can be more useful than selecting a pattern based only on its name.
Final Takeaway
Candlestick patterns are best viewed as a language of price behavior, not a collection of automatic buy and sell signals.
A Doji can reveal indecision.
A Hammer or Shooting Star can show rejection.
An Engulfing pattern can show a sharp shift in control.
A Morning Star or Evening Star can show that momentum changed over several candles.
But none of those formations should be separated from the market around them.
The most useful question is not:
“Does this candle predict what happens next?”
It is:
“Where did this pattern appear, what behavior does it reveal, and what would confirm that the balance between buyers and sellers has actually changed?”
That is a more disciplined way to use candlestick analysis.
References
CME Group — Chart Types: Candlestick, Line, Bar
CME Group's technical-analysis education explains how candle bodies represent the open and close while shadows represent the period's high and low.
Charles Schwab — How to Read Stock Charts and Trading Patterns
Schwab explains candlestick construction and their use for visually interpreting bullish and bearish price behavior.
Charles Schwab — Getting Started with Technical Analysis: Candlestick Basics
Schwab's educational material specifically discusses candlestick behavior around support and resistance.
Fidelity Investments — Identifying Chart Patterns with Technical Analysis
Fidelity discusses chart patterns, confirmation methods, support and resistance, and the limitations of relying on patterns without sufficient evidence.
IG — 16 Candlestick Patterns Every Trader Should Know
IG's educational guide covers Doji, Hammer, Shooting Star, Bullish and Bearish Engulfing, Morning Star, Evening Star, and the importance of context and confirmation.
Educational Notice
This material is provided for educational and informational purposes only. Candlestick patterns are based on historical price behavior and do not guarantee future market direction or investment performance.
Nothing in this article should be interpreted as a recommendation to buy, sell, or hold any security. Investors should consider their own objectives, risk tolerance, and additional market information before making investment decisions.