Why Did Nvidia Drop Today? What Drove NVDA and Chip Stocks Lower
Quick Take
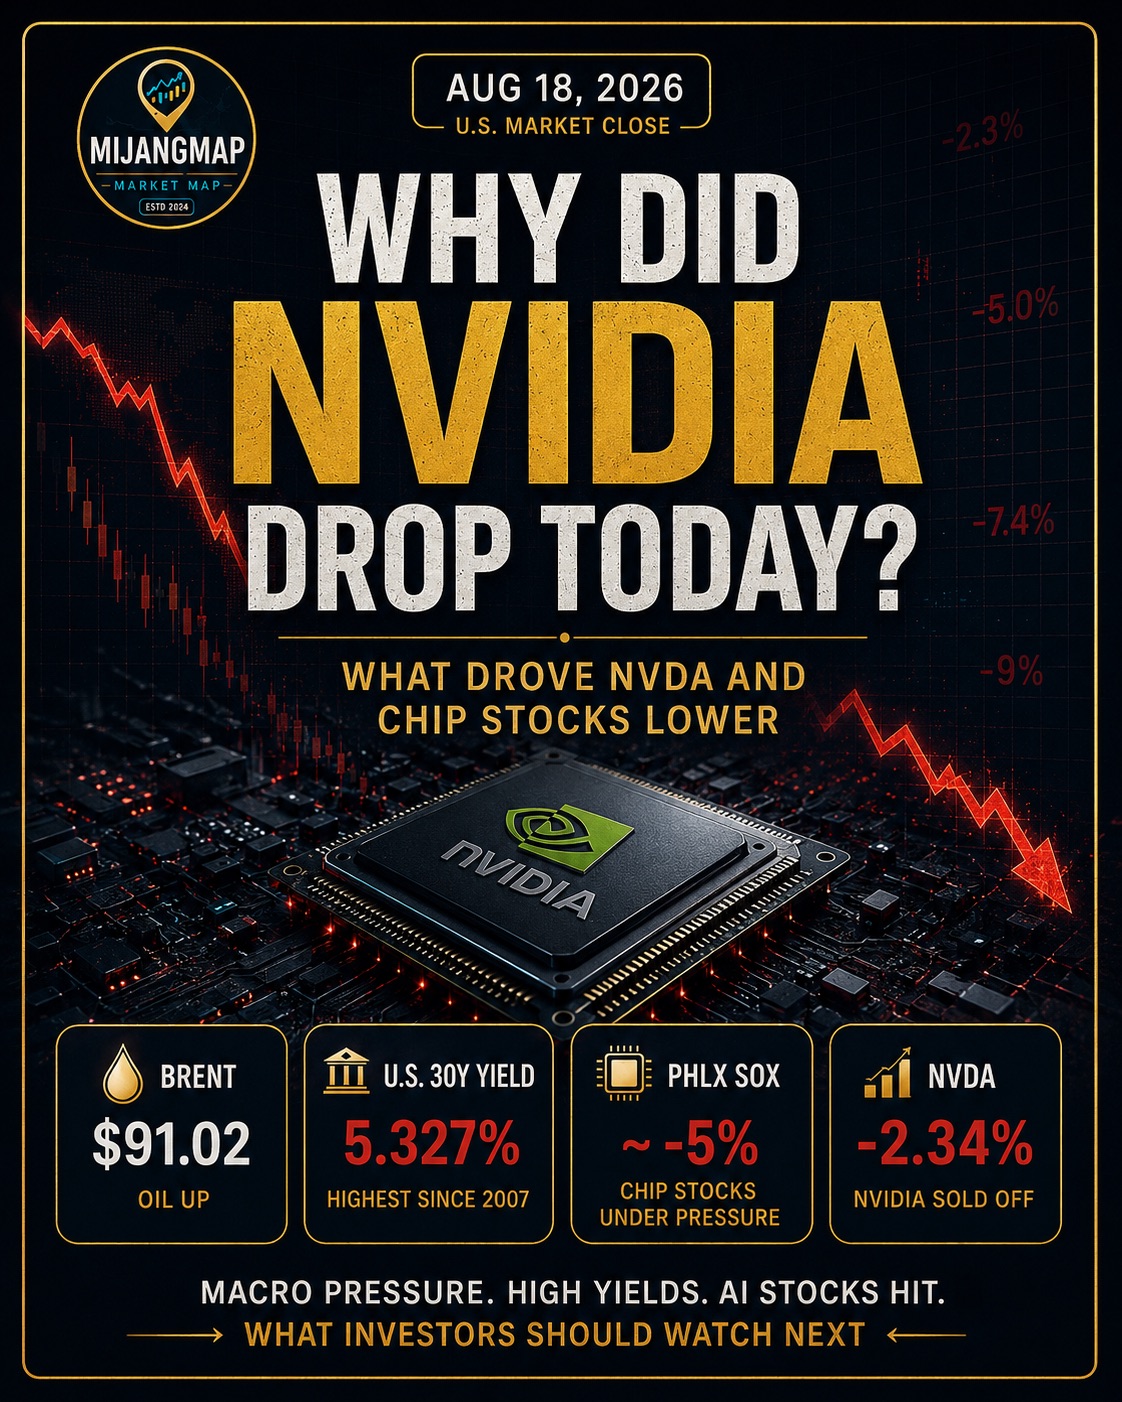
Nvidia shares fell 2.34% on August 18 as semiconductor stocks led a broader technology sell-off.
But there was no single new Nvidia-specific event that fully explained the move.
The bigger story was macro-driven. Long-term U.S. Treasury yields climbed to their highest levels since 2007, Brent crude closed above $91, and investors reduced exposure to some of the market’s highest-valued AI and semiconductor stocks.
Key Points
• Nvidia fell 2.34% to $219.74.
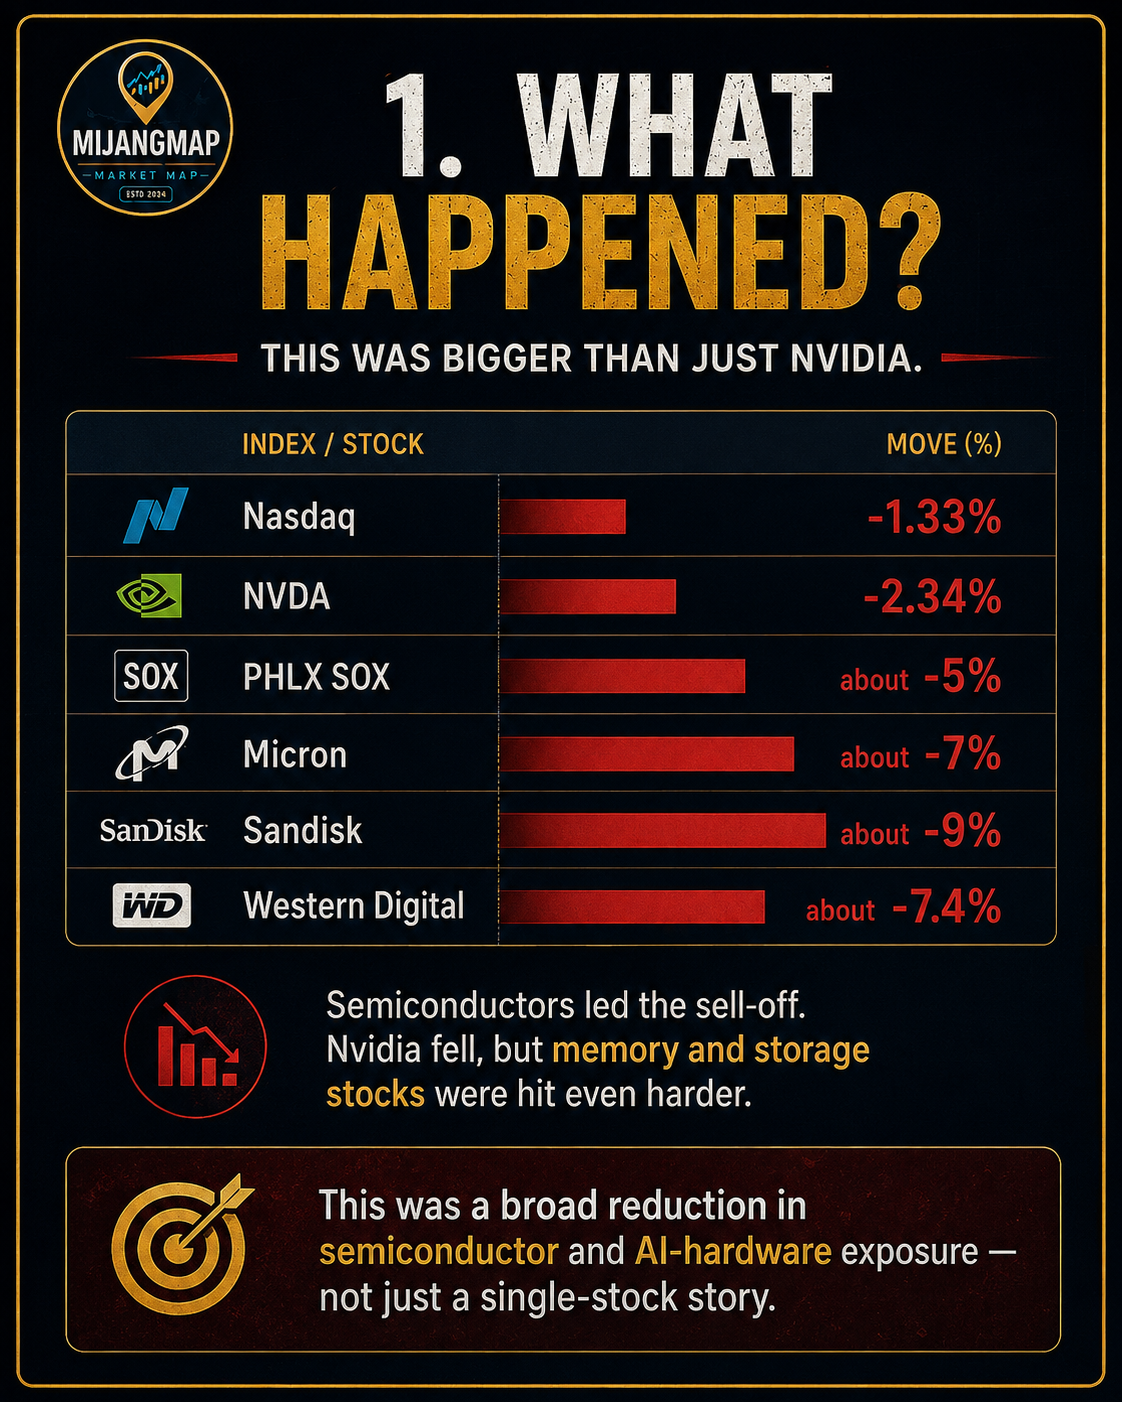
• The Nasdaq dropped 1.33%.
• The Philadelphia Semiconductor Index fell about 5%.
• Micron fell about 7%.
• Sandisk fell about 9%.
• Western Digital fell about 7.4%.
• The U.S. 30-year Treasury yield rose to 5.327%, its highest level since 2007.
• Brent crude closed at $91.02.
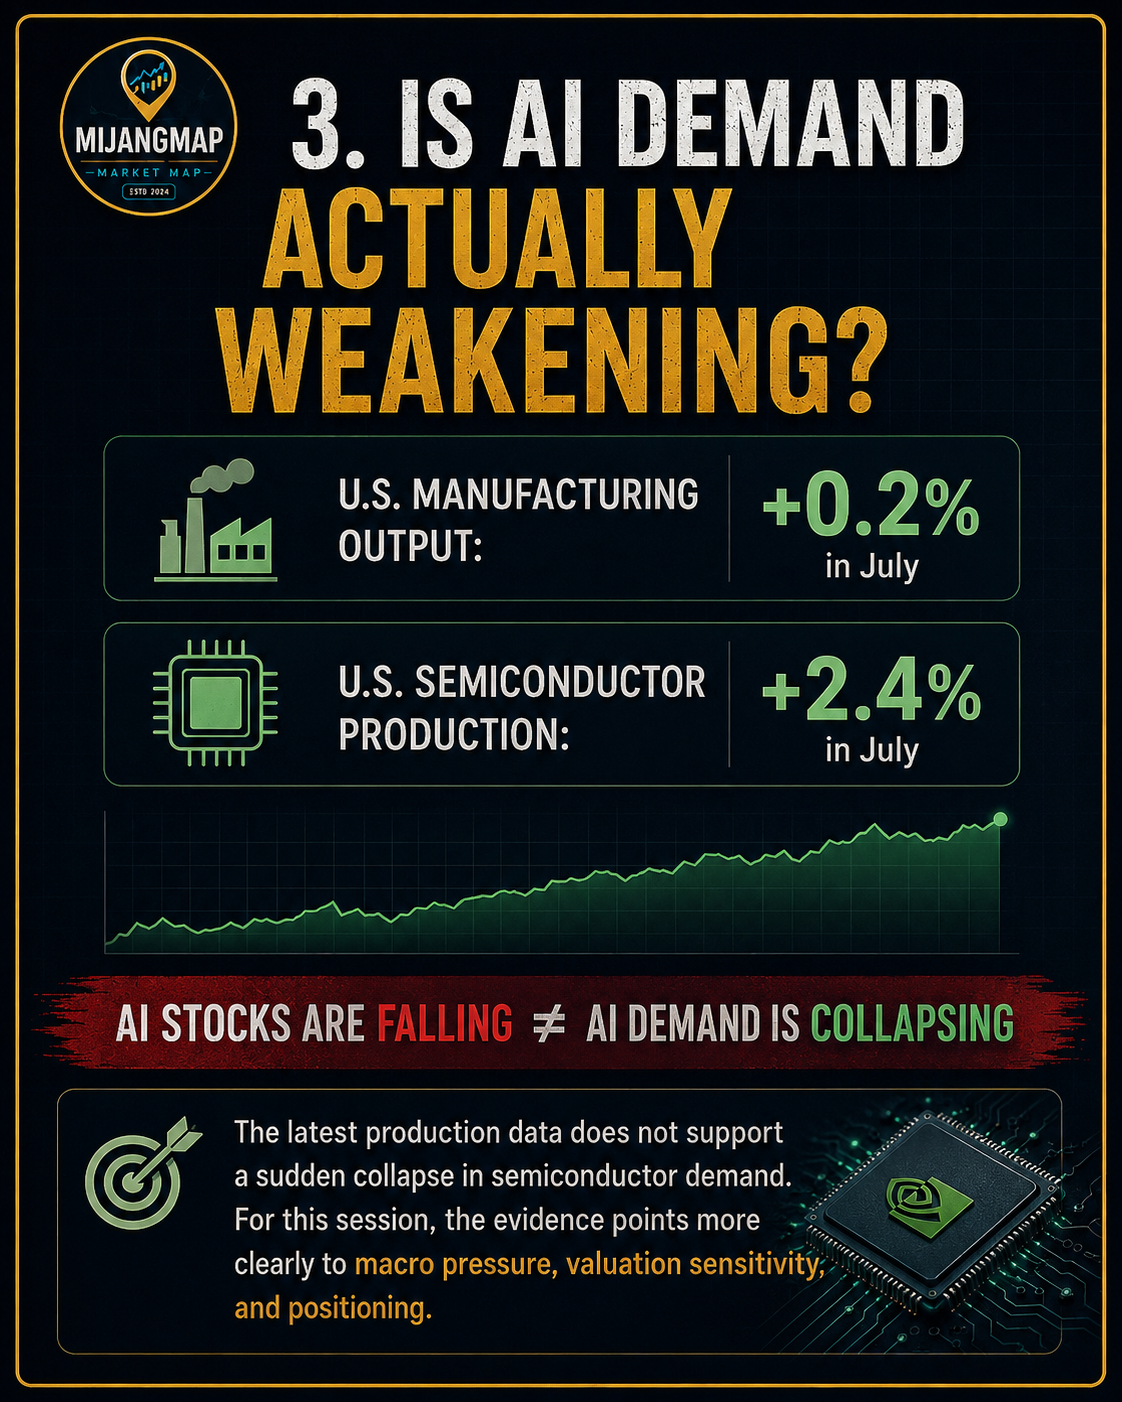
• U.S. manufacturing output increased 0.2% in July.
• U.S. semiconductor production increased 2.4% in July.
That final point matters.
AI stocks were falling, but the latest manufacturing data did not show an equivalent collapse in semiconductor demand.
Technology stocks sold off sharply on August 18, with semiconductors taking the biggest hit.
The Nasdaq fell 1.33%, while the Philadelphia Semiconductor Index lost roughly 5%.
Nvidia declined 2.34%, but the weakness was even more pronounced across memory and storage-related names. Micron fell about 7%, Sandisk fell about 9%, and Western Digital dropped about 7.4%.
This was not simply an Nvidia story.
It was a broader reduction in semiconductor and AI-hardware exposure.
2. Why Did Nvidia and Chip Stocks Fall? The first place to look was not Nvidia.
It was the bond market.
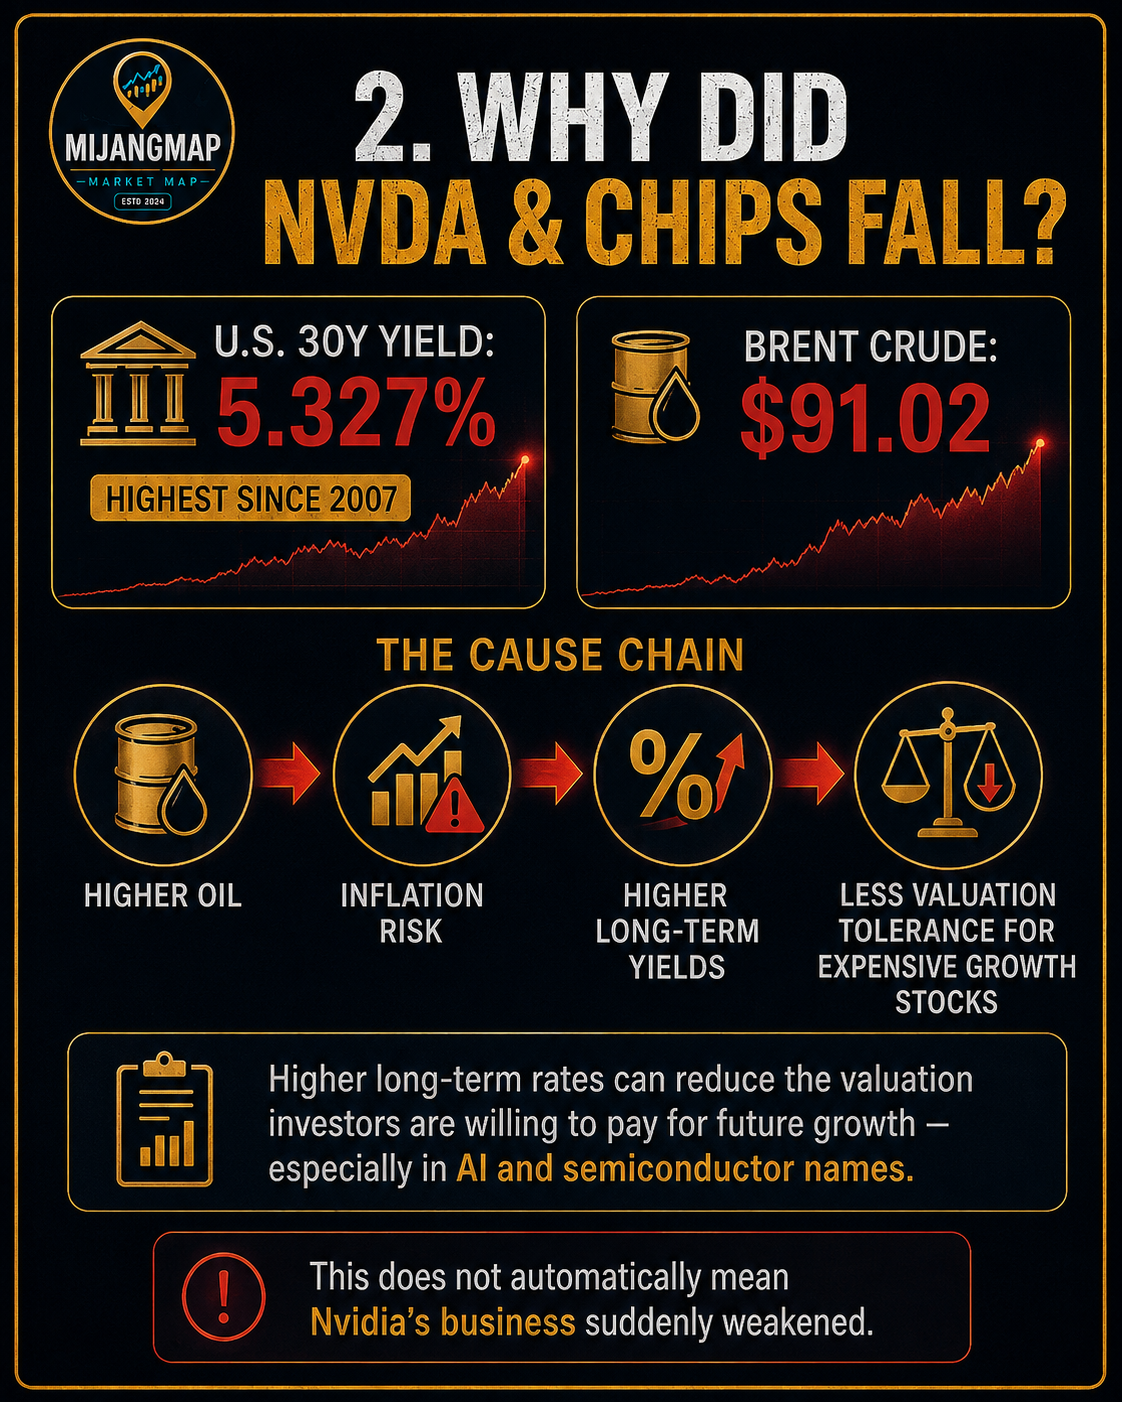
The U.S. 30-year Treasury yield climbed to 5.327%, its highest level since 2007.
Why does that matter?
Higher long-term interest rates raise the discount rate investors apply to future corporate earnings. For companies whose valuations depend heavily on years of expected future growth, rapidly rising yields can reduce how much investors are willing to pay today.
That does not automatically mean Nvidia’s business became weaker.
It means the valuation investors assign to future growth can change very quickly when rates move higher.
3. Oil Became Part of the Story
Brent crude closed at $91.02 as fading hopes for a U.S.-Iran diplomatic breakthrough and continuing concerns around supply risks supported oil prices.
That created an important market chain:
Higher oil
→ higher inflation risk
→ pressure on long-term yields
→ less valuation tolerance for expensive growth stocks
Oil was not the only factor pushing yields higher.
U.S. fiscal deficits, heavy Treasury issuance, and large financing needs tied to infrastructure and corporate investment have also been part of the broader bond-market story.
4. Is AI Demand Actually Weakening?
This is the most important distinction.
U.S. manufacturing output increased 0.2% in July.
Semiconductor production increased 2.4%.
That suggests AI-related investment and broader chip demand were not showing the kind of immediate collapse that a one-day stock sell-off might imply.
Investors should separate two very different statements:
“AI stocks are falling.”
and
“AI demand is collapsing.”
They are not necessarily the same thing.
For this session, the available evidence points more clearly to macro pressure, valuation sensitivity, and positioning than to a sudden collapse in AI demand.
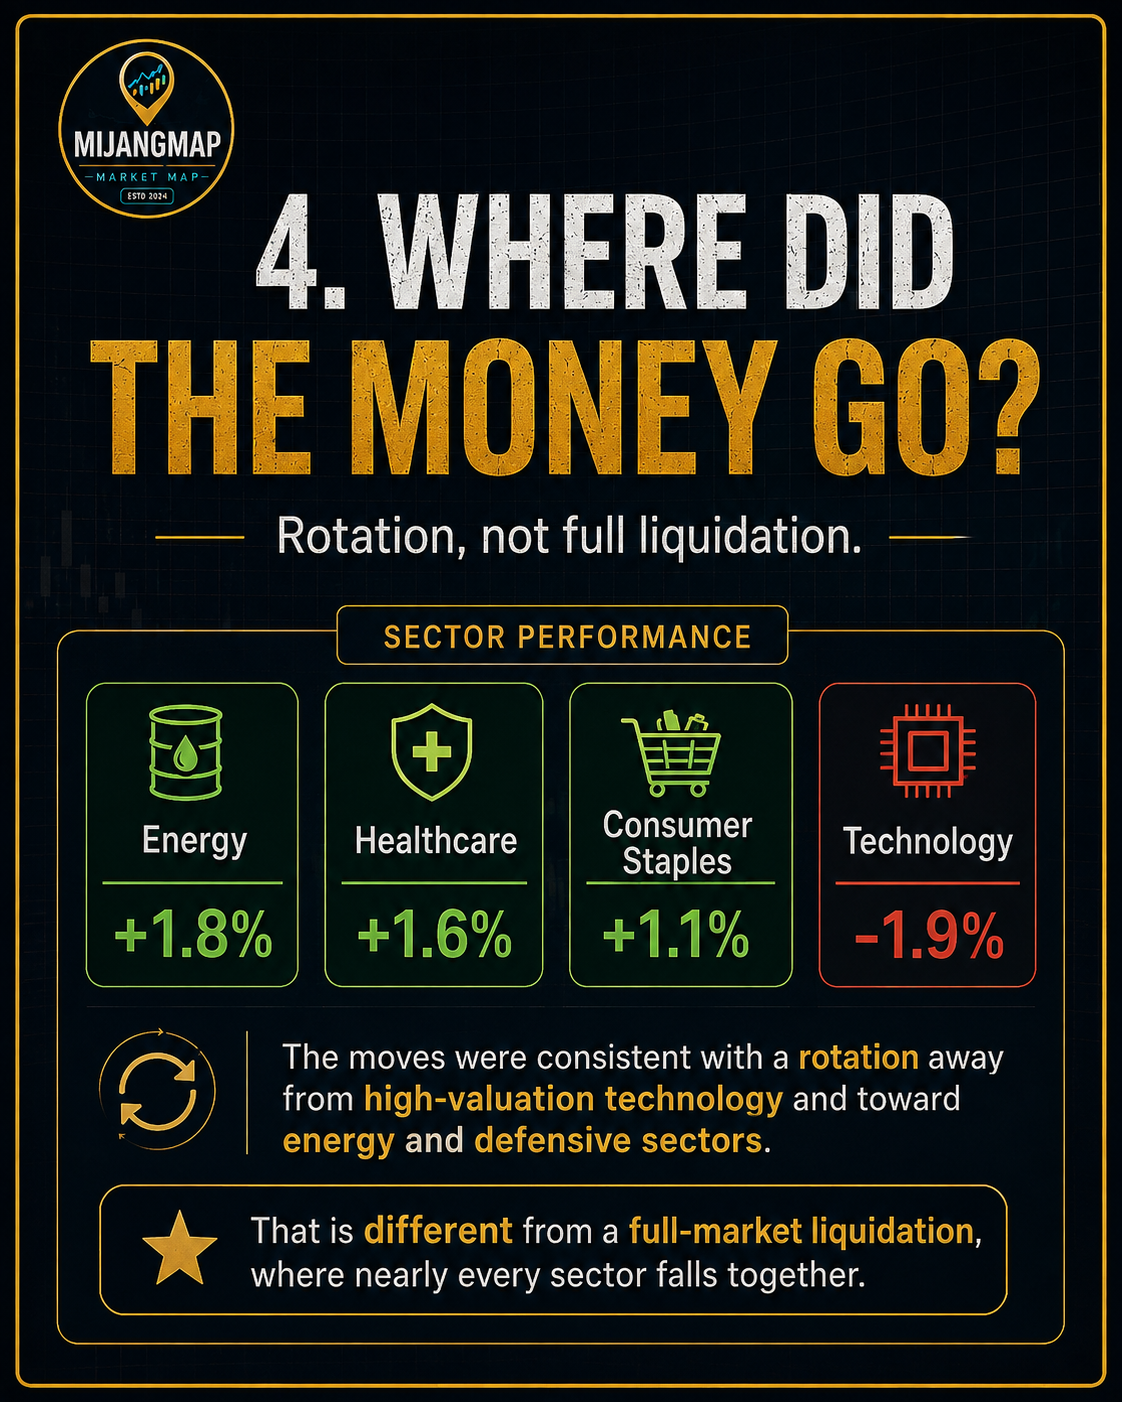
5. Where Did the Money Go?
Not every sector fell.
On the same day:
Energy rose 1.8%.
Healthcare gained 1.6%.
Consumer Staples added 1.1%.
Technology was the weakest major S&P 500 sector, falling 1.9%.
Those moves were consistent with a rotation away from high-valuation technology and toward energy and defensive sectors.
That is very different from a full-market liquidation where nearly every sector falls together.
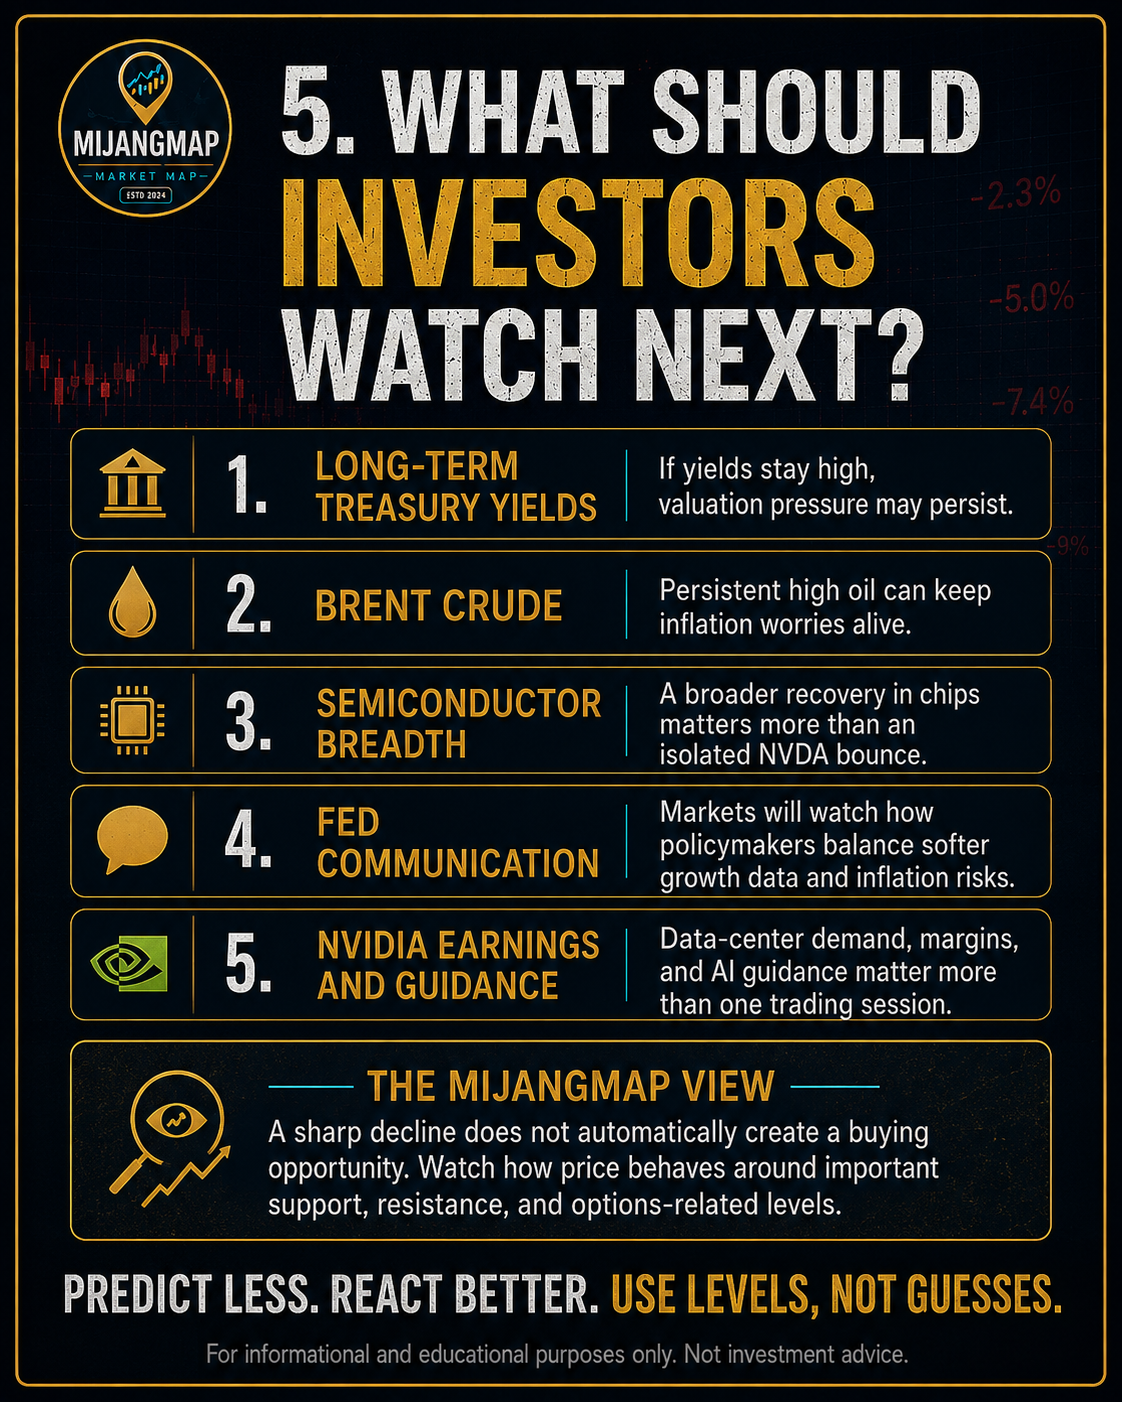
6. What Should Nvidia Investors Watch Next?
Long-Term Treasury Yields
The 30-year yield around 5.3% has become an important macro reference point. If long-term yields remain elevated, valuation pressure on growth stocks may stay stronger.
Brent Crude
The key question is not simply whether oil crossed $90. It is whether elevated energy prices persist long enough to affect inflation expectations.
Semiconductor Breadth
A broad recovery across semiconductor stocks and ETFs would provide stronger confirmation than an isolated NVDA bounce.
Federal Reserve Communication
Investors will continue watching upcoming Fed communication for how policymakers balance softer growth data against inflation risks.
Nvidia’s Next Earnings Update
Ultimately, data-center revenue, margins, AI infrastructure demand, and management guidance will provide stronger evidence about real business demand than one trading session.
The MijangMap View
A sharp decline does not automatically create a buying opportunity.
Instead of guessing where NVDA will move next, it is more useful to watch how price behaves around important support, resistance, and options-related levels.
If an important level breaks, the next question is not simply:
“Is the stock cheap?”
A better question is:
Does price recover that level — and can it hold after the recovery?
That is the difference between predicting a bottom and responding to price structure.
Predict less.
React better.
Use levels, not guesses.
Investment Information Notice
Market information, chart analysis, support and resistance levels, and related data provided by MijangMap are intended for informational and educational purposes only.
They are based on historical prices, technical indicators, options data, and currently available market information and do not guarantee future price movements or investment performance.
Nothing presented constitutes a recommendation to buy or sell any financial product.
이 글에는 원문 출처 링크가 등록되지 않았습니다. 경제지표·기업 발표의 수치는 공식 발표와 대조해 확인해 주세요.

 개별종목
개별종목 시장
시장 시장
시장 시장
시장